Tape reading involves analyzing real-time order flow and price action to gauge market sentiment, focusing on volume, bid-ask spreads, and time-stamped trade data. Technical analysis relies on historical price charts, patterns, and technical indicators to predict future price movements based on market trends. Discover more about how these complementary strategies can enhance your trading decisions.
Why it is important
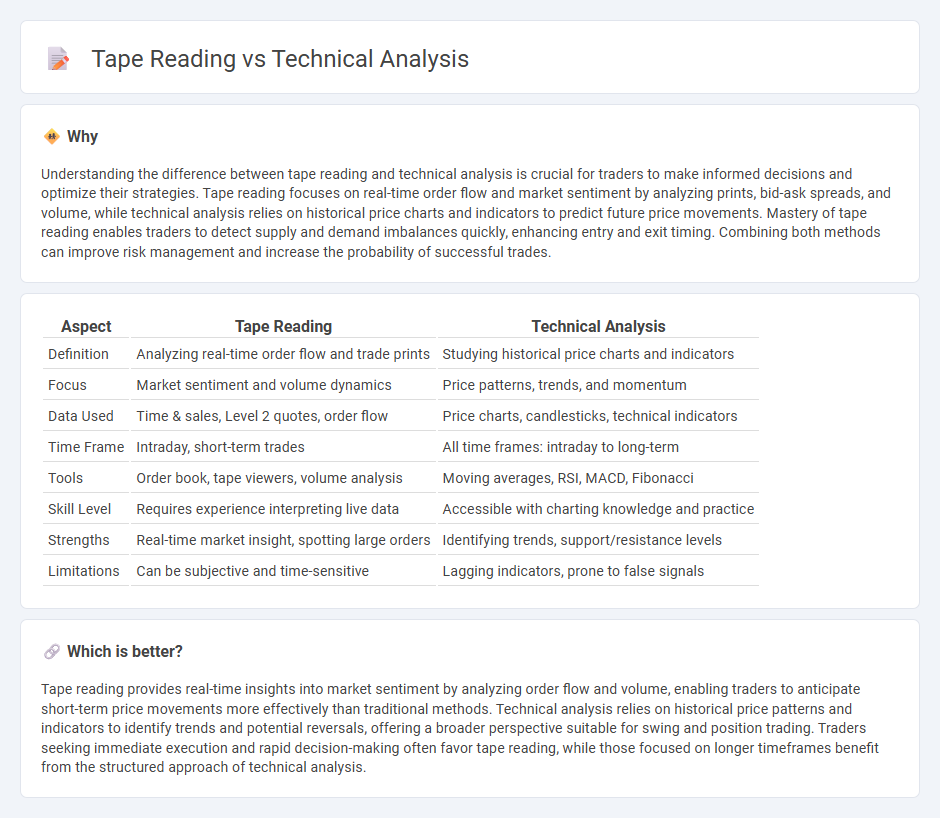
Understanding the difference between tape reading and technical analysis is crucial for traders to make informed decisions and optimize their strategies. Tape reading focuses on real-time order flow and market sentiment by analyzing prints, bid-ask spreads, and volume, while technical analysis relies on historical price charts and indicators to predict future price movements. Mastery of tape reading enables traders to detect supply and demand imbalances quickly, enhancing entry and exit timing. Combining both methods can improve risk management and increase the probability of successful trades.
Comparison Table
| Aspect | Tape Reading | Technical Analysis |
|---|---|---|
| Definition | Analyzing real-time order flow and trade prints | Studying historical price charts and indicators |
| Focus | Market sentiment and volume dynamics | Price patterns, trends, and momentum |
| Data Used | Time & sales, Level 2 quotes, order flow | Price charts, candlesticks, technical indicators |
| Time Frame | Intraday, short-term trades | All time frames: intraday to long-term |
| Tools | Order book, tape viewers, volume analysis | Moving averages, RSI, MACD, Fibonacci |
| Skill Level | Requires experience interpreting live data | Accessible with charting knowledge and practice |
| Strengths | Real-time market insight, spotting large orders | Identifying trends, support/resistance levels |
| Limitations | Can be subjective and time-sensitive | Lagging indicators, prone to false signals |
Which is better?
Tape reading provides real-time insights into market sentiment by analyzing order flow and volume, enabling traders to anticipate short-term price movements more effectively than traditional methods. Technical analysis relies on historical price patterns and indicators to identify trends and potential reversals, offering a broader perspective suitable for swing and position trading. Traders seeking immediate execution and rapid decision-making often favor tape reading, while those focused on longer timeframes benefit from the structured approach of technical analysis.
Connection
Tape reading and technical analysis both analyze market data to predict price movements; tape reading focuses on real-time order flow and volume to gauge market sentiment, while technical analysis uses historical price charts and indicators to identify trends and patterns. Integrating tape reading with technical analysis enhances a trader's ability to validate signals and make more informed decisions in fast-moving markets. This combination improves timing precision and risk management by offering a comprehensive view of market behavior.
Key Terms
**Technical Analysis:**
Technical analysis utilizes historical price data, chart patterns, and technical indicators such as moving averages, RSI, and MACD to predict future market movements. It is widely employed by traders to identify trends, support and resistance levels, and potential entry or exit points in various markets including stocks, forex, and cryptocurrencies. Explore detailed strategies and tools to enhance your trading decisions through technical analysis.
Chart Patterns
Chart patterns play a crucial role in technical analysis by identifying potential price movements based on historical data. Tape reading, by contrast, emphasizes real-time order flow and volume activity to gauge market sentiment and momentum. Explore deeper insights into how chart patterns and tape reading can complement each other in trading strategies.
Indicators (e.g., RSI, MACD)
Technical analysis relies heavily on indicators like RSI (Relative Strength Index) and MACD (Moving Average Convergence Divergence) to identify price trends and momentum in stock trading. Tape reading, by contrast, focuses on real-time order flow and volume to gauge market sentiment and predict short-term price movements without relying on lagging indicators. Explore these methodologies further to enhance your trading strategy and understanding.
Source and External Links
Technical analysis - A methodology for analyzing and forecasting price direction by studying past market data, based on principles that market prices reflect all relevant information and tend to move in trends due to collective investor behavior.
Technical Analysis - A Beginner's Guide - A method used to predict future price movements of securities by analyzing past market data, with traders selecting time frames and indicators aligned to their trading style for decision-making.
Beginners Guide to Technical Analysis | Learn to Trade - Technical analysis involves studying price charts and statistics to identify trends, support and resistance levels, and using tools like moving averages and momentum indicators for high-probability trading decisions.
 dowidth.com