Quantitative signals utilize mathematical models and statistical algorithms to identify trading opportunities based on historical data and market patterns. Technical analysis focuses on chart patterns, price movements, and volume indicators to predict future market trends. Explore the key differences and benefits of each approach to enhance your trading strategy.
Why it is important
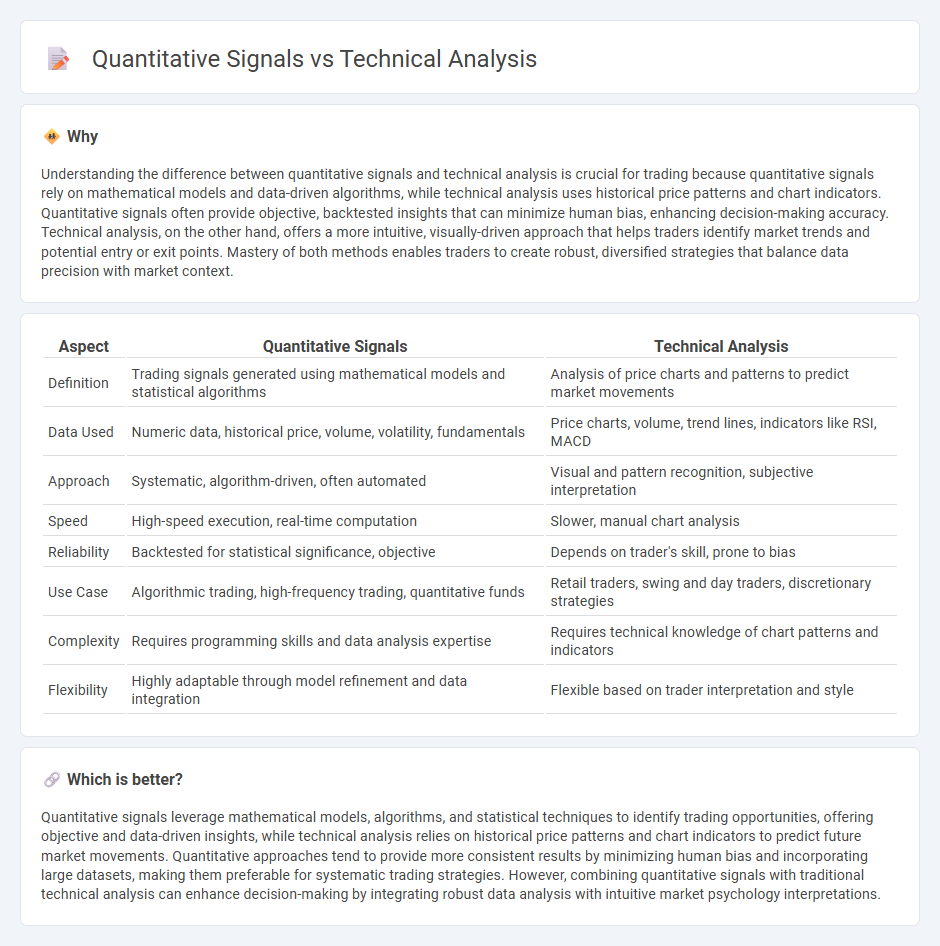
Understanding the difference between quantitative signals and technical analysis is crucial for trading because quantitative signals rely on mathematical models and data-driven algorithms, while technical analysis uses historical price patterns and chart indicators. Quantitative signals often provide objective, backtested insights that can minimize human bias, enhancing decision-making accuracy. Technical analysis, on the other hand, offers a more intuitive, visually-driven approach that helps traders identify market trends and potential entry or exit points. Mastery of both methods enables traders to create robust, diversified strategies that balance data precision with market context.
Comparison Table
| Aspect | Quantitative Signals | Technical Analysis |
|---|---|---|
| Definition | Trading signals generated using mathematical models and statistical algorithms | Analysis of price charts and patterns to predict market movements |
| Data Used | Numeric data, historical price, volume, volatility, fundamentals | Price charts, volume, trend lines, indicators like RSI, MACD |
| Approach | Systematic, algorithm-driven, often automated | Visual and pattern recognition, subjective interpretation |
| Speed | High-speed execution, real-time computation | Slower, manual chart analysis |
| Reliability | Backtested for statistical significance, objective | Depends on trader's skill, prone to bias |
| Use Case | Algorithmic trading, high-frequency trading, quantitative funds | Retail traders, swing and day traders, discretionary strategies |
| Complexity | Requires programming skills and data analysis expertise | Requires technical knowledge of chart patterns and indicators |
| Flexibility | Highly adaptable through model refinement and data integration | Flexible based on trader interpretation and style |
Which is better?
Quantitative signals leverage mathematical models, algorithms, and statistical techniques to identify trading opportunities, offering objective and data-driven insights, while technical analysis relies on historical price patterns and chart indicators to predict future market movements. Quantitative approaches tend to provide more consistent results by minimizing human bias and incorporating large datasets, making them preferable for systematic trading strategies. However, combining quantitative signals with traditional technical analysis can enhance decision-making by integrating robust data analysis with intuitive market psychology interpretations.
Connection
Quantitative signals use mathematical models and statistical techniques to identify patterns and trends in trading data, while technical analysis relies on chart patterns, indicators, and historical price movements to forecast market behavior. Both approaches analyze price action and volume data, enabling traders to develop algorithm-driven strategies that systematically exploit market inefficiencies. Integrating quantitative signals with technical analysis enhances decision-making by combining data-driven insights with traditional market psychology indicators.
Key Terms
**Technical Analysis:**
Technical analysis relies on chart patterns, trend lines, and volume indicators to predict market movements by analyzing historical price data. Traders use tools like moving averages, RSI, and MACD to identify potential buy or sell signals based on market psychology and price momentum. Explore more to understand how these techniques can enhance trading strategies and decision-making.
Chart Patterns
Chart patterns play a crucial role in technical analysis by identifying price trends and potential reversals through visual formations such as head and shoulders, triangles, and flags. Quantitative signals incorporate these patterns into algorithmic models, enhancing accuracy by combining statistical methods and historical data analysis. Explore how integrating chart patterns with quantitative techniques can optimize predictive trading strategies.
Support and Resistance
Support and resistance levels form the foundation of technical analysis, identifying price points where assets consistently reverse direction due to buying or selling pressure. Quantitative signals leverage algorithmic models and statistical methods to detect and predict these levels dynamically, often incorporating volume, momentum, and volatility metrics for enhanced precision. Explore the integration of technical and quantitative approaches to optimize trading strategies based on support and resistance insights.
Source and External Links
TECHNICAL ANALYSIS - SRCC - Technical analysis studies stock price graphs and momentum oscillators, based entirely on price history, assuming that all market information is already reflected in prices and that price moves in trends that tend to repeat over time, as exemplified by the Dow Theory's primary, secondary, and minor trends.
Technical analysis - Wikipedia - Technical analysis is a methodology for forecasting price direction by analyzing past market data, based on principles that market prices reflect all information, prices move in trends, and price patterns tend to repeat due to investor behavior.
Technical Analysis - A Beginner's Guide - Corporate Finance Institute - Technical analysis predicts future price movements by examining market data and price charts, using various time frames and indicators, with many traders combining it with fundamental analysis to optimize trade entries and exits.