Options flow reveals real-time market sentiment by tracking large trades and unusual options activity, providing insight into institutional investor behavior. Technical analysis uses historical price data and chart patterns to predict future price movements based on market trends and momentum. Explore the strengths and applications of both methods to enhance your trading strategy.
Why it is important
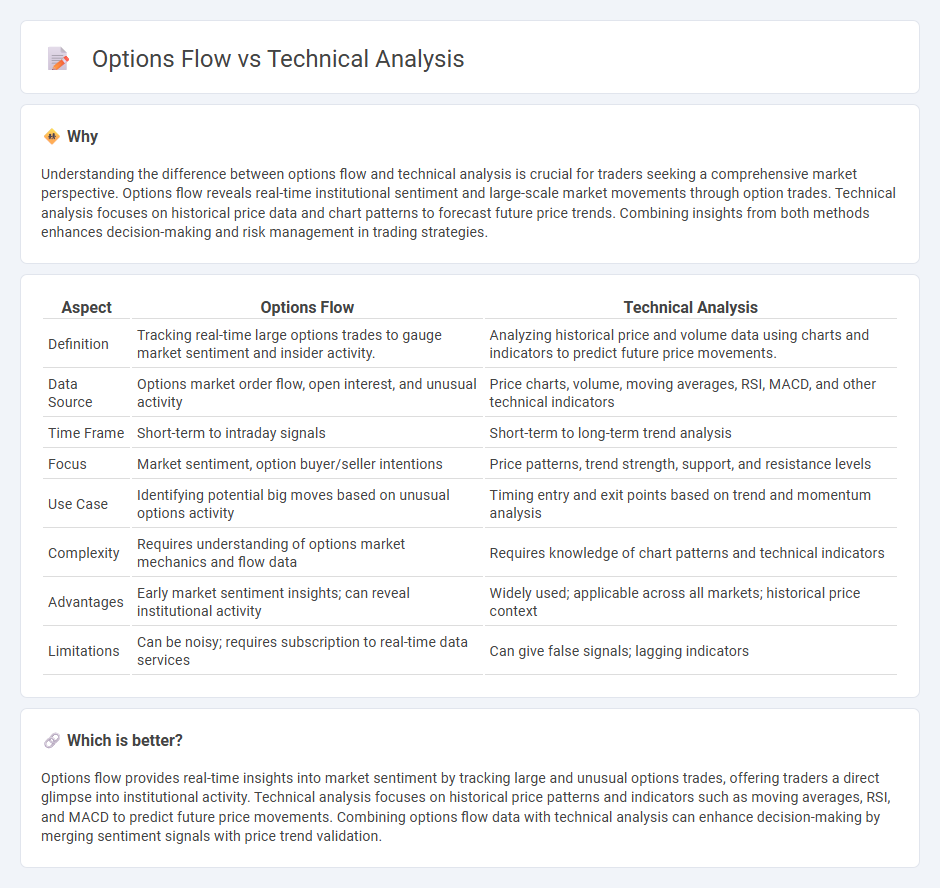
Understanding the difference between options flow and technical analysis is crucial for traders seeking a comprehensive market perspective. Options flow reveals real-time institutional sentiment and large-scale market movements through option trades. Technical analysis focuses on historical price data and chart patterns to forecast future price trends. Combining insights from both methods enhances decision-making and risk management in trading strategies.
Comparison Table
| Aspect | Options Flow | Technical Analysis |
|---|---|---|
| Definition | Tracking real-time large options trades to gauge market sentiment and insider activity. | Analyzing historical price and volume data using charts and indicators to predict future price movements. |
| Data Source | Options market order flow, open interest, and unusual activity | Price charts, volume, moving averages, RSI, MACD, and other technical indicators |
| Time Frame | Short-term to intraday signals | Short-term to long-term trend analysis |
| Focus | Market sentiment, option buyer/seller intentions | Price patterns, trend strength, support, and resistance levels |
| Use Case | Identifying potential big moves based on unusual options activity | Timing entry and exit points based on trend and momentum analysis |
| Complexity | Requires understanding of options market mechanics and flow data | Requires knowledge of chart patterns and technical indicators |
| Advantages | Early market sentiment insights; can reveal institutional activity | Widely used; applicable across all markets; historical price context |
| Limitations | Can be noisy; requires subscription to real-time data services | Can give false signals; lagging indicators |
Which is better?
Options flow provides real-time insights into market sentiment by tracking large and unusual options trades, offering traders a direct glimpse into institutional activity. Technical analysis focuses on historical price patterns and indicators such as moving averages, RSI, and MACD to predict future price movements. Combining options flow data with technical analysis can enhance decision-making by merging sentiment signals with price trend validation.
Connection
Options flow provides real-time data on large trades and institutional activity, offering insights into market sentiment that complement technical analysis patterns. Traders use options flow to identify potential price movements, enhancing technical indicators like moving averages and volume trends. Combining options flow with technical analysis improves trade timing and risk management by confirming signals from charts with market participant behavior.
Key Terms
**Technical Analysis:**
Technical analysis uses historical price data, volume, and charts to identify market trends and predict future price movements, relying heavily on indicators like moving averages, RSI, and MACD. It emphasizes patterns, trend lines, and support/resistance levels to guide trading decisions. Explore deeper insights into technical analysis to enhance your trading strategy.
Chart Patterns
Chart patterns in technical analysis provide visual insights into market trends and potential price movements by identifying formations like head and shoulders, triangles, and double tops. Options flow complements this by revealing the real-time sentiment and large traders' positions through unusual options activity, offering a deeper understanding of market direction. Explore more to master combining chart patterns with options flow for enhanced trading strategies.
Moving Averages
Moving averages are a fundamental tool in technical analysis, smoothing price data to identify trends and potential support or resistance levels. Options flow analysis provides real-time insights into market sentiment by tracking large option trades and unusual activity that may signal future price movements. Explore how combining moving averages with options flow enhances your trading strategy by offering both trend confirmation and market sentiment clues.
Source and External Links
Technical analysis - It is a methodology for analyzing and forecasting price directions by studying past market data, based on the principles that market prices reflect all relevant information and tend to move in trends due to investor behavior patterns.
Technical Analysis - A Beginner's Guide - This method predicts future price movements based on historical price action and market data, emphasizing that collective trading activity reflects fair market value and that technical traders use different time frames and indicators suited to their trading style.
Beginners Guide to Technical Analysis | Learn to Trade - Technical analysis starts with chart reading to identify trends, support, and resistance levels, using tools like moving averages and momentum indicators to gauge how fast and where prices may move, leveraging the principle that price history tends to repeat itself.