High-frequency tick charts capture every trade in real-time, providing detailed insight into market microstructure and enabling precise entry and exit points for traders focusing on millisecond-level price movements. Momentum charts aggregate price changes over short intervals to highlight price trends and shifts in trading momentum, ideal for traders emphasizing trend strength and market direction. Explore how integrating these advanced trading charts can optimize your strategy and improve execution efficiency.
Why it is important
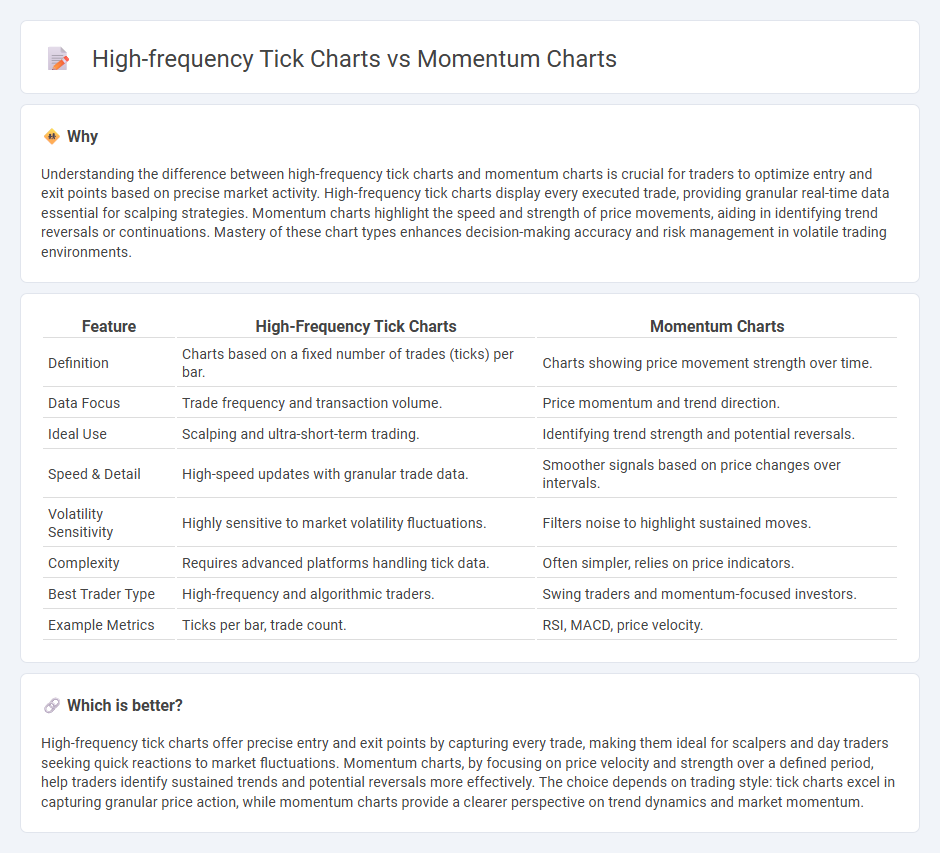
Understanding the difference between high-frequency tick charts and momentum charts is crucial for traders to optimize entry and exit points based on precise market activity. High-frequency tick charts display every executed trade, providing granular real-time data essential for scalping strategies. Momentum charts highlight the speed and strength of price movements, aiding in identifying trend reversals or continuations. Mastery of these chart types enhances decision-making accuracy and risk management in volatile trading environments.
Comparison Table
| Feature | High-Frequency Tick Charts | Momentum Charts |
|---|---|---|
| Definition | Charts based on a fixed number of trades (ticks) per bar. | Charts showing price movement strength over time. |
| Data Focus | Trade frequency and transaction volume. | Price momentum and trend direction. |
| Ideal Use | Scalping and ultra-short-term trading. | Identifying trend strength and potential reversals. |
| Speed & Detail | High-speed updates with granular trade data. | Smoother signals based on price changes over intervals. |
| Volatility Sensitivity | Highly sensitive to market volatility fluctuations. | Filters noise to highlight sustained moves. |
| Complexity | Requires advanced platforms handling tick data. | Often simpler, relies on price indicators. |
| Best Trader Type | High-frequency and algorithmic traders. | Swing traders and momentum-focused investors. |
| Example Metrics | Ticks per bar, trade count. | RSI, MACD, price velocity. |
Which is better?
High-frequency tick charts offer precise entry and exit points by capturing every trade, making them ideal for scalpers and day traders seeking quick reactions to market fluctuations. Momentum charts, by focusing on price velocity and strength over a defined period, help traders identify sustained trends and potential reversals more effectively. The choice depends on trading style: tick charts excel in capturing granular price action, while momentum charts provide a clearer perspective on trend dynamics and market momentum.
Connection
High-frequency tick charts capture every trade executed in milliseconds, providing granular data crucial for identifying short-term price movements and market momentum. Momentum charts analyze the velocity and strength of price changes over these tick intervals, enabling traders to assess market trends in real time. Integrating high-frequency tick data with momentum analysis enhances the precision of trading strategies by revealing immediate shifts in buying or selling pressure.
Key Terms
Time Frame
Momentum charts capture price changes based on predefined price movements, highlighting market momentum within dynamic time frames, whereas high-frequency tick charts plot every trade or tick, offering granular data in fixed transaction intervals regardless of time. Momentum charts provide better clarity on trend strength during volatile periods, while high-frequency tick charts excel in detailed order flow analysis ideal for scalping strategies. Explore further to determine which chart type aligns best with your trading goals and time frame preferences.
Trade Volume
Momentum charts emphasize price movement velocity by grouping trades based on price changes, offering insights into market trend strength and shifts. High-frequency tick charts focus on trade volume and transaction frequency, plotting data after a set number of trades to capture market activity intensity at a granular level. Explore detailed comparisons to understand how these chart types can optimize volume-based trading strategies.
Signal Frequency
Momentum charts measure price changes based on defined percentage movements, providing a clear signal frequency tied to market volatility, while high-frequency tick charts plot transactions after a set number of trades, offering more time-based signal granularity. The signal frequency in momentum charts adapts to price action intensity, leading to variable intervals, whereas tick charts deliver consistent trade-count intervals regardless of price shifts. Explore further to understand which chart type best aligns with your trading strategy and signal accuracy needs.
Source and External Links
Momentum Bar Chart - Momentum charts display price movements through bars with fixed price ranges rather than set time intervals, highlighting significant price action and filtering out market noise for clearer trend analysis.
Momentum (technical analysis) - Wikipedia - Momentum indicators measure the difference in closing prices over a set period to show trend strength and direction, with zero-crossings used to signal potential buy or sell points.
Momentum Indicator - Incredible Charts - This indicator calculates the rate of change of closing prices to detect trend weakness and reversal signals, often used alongside defined overbought and oversold levels to generate trading signals.