On-chain analytics leverages blockchain data such as transaction volume, wallet activity, and network health to provide real-time insights into market behavior and asset trends. Technical analysis relies on historical price patterns, volume charts, and indicators like moving averages and RSI to predict future price movements. Explore deeper to understand how combining both methods can enhance trading strategies.
Why it is important
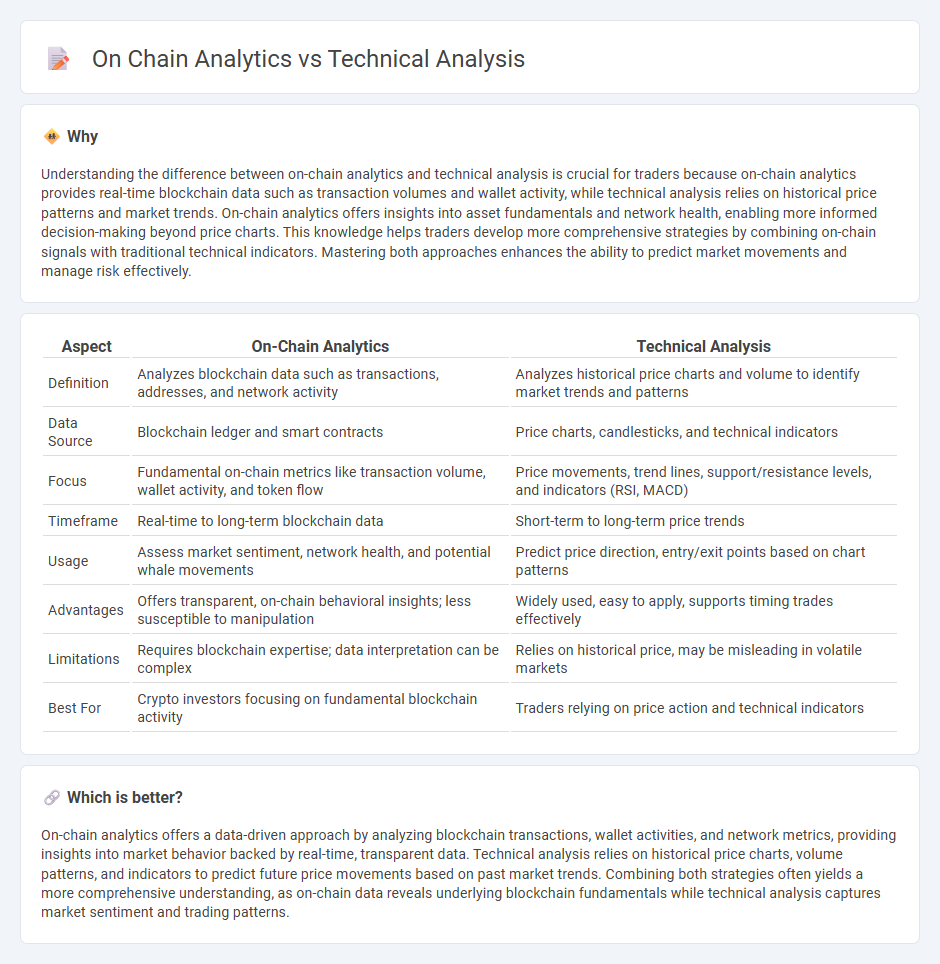
Understanding the difference between on-chain analytics and technical analysis is crucial for traders because on-chain analytics provides real-time blockchain data such as transaction volumes and wallet activity, while technical analysis relies on historical price patterns and market trends. On-chain analytics offers insights into asset fundamentals and network health, enabling more informed decision-making beyond price charts. This knowledge helps traders develop more comprehensive strategies by combining on-chain signals with traditional technical indicators. Mastering both approaches enhances the ability to predict market movements and manage risk effectively.
Comparison Table
| Aspect | On-Chain Analytics | Technical Analysis |
|---|---|---|
| Definition | Analyzes blockchain data such as transactions, addresses, and network activity | Analyzes historical price charts and volume to identify market trends and patterns |
| Data Source | Blockchain ledger and smart contracts | Price charts, candlesticks, and technical indicators |
| Focus | Fundamental on-chain metrics like transaction volume, wallet activity, and token flow | Price movements, trend lines, support/resistance levels, and indicators (RSI, MACD) |
| Timeframe | Real-time to long-term blockchain data | Short-term to long-term price trends |
| Usage | Assess market sentiment, network health, and potential whale movements | Predict price direction, entry/exit points based on chart patterns |
| Advantages | Offers transparent, on-chain behavioral insights; less susceptible to manipulation | Widely used, easy to apply, supports timing trades effectively |
| Limitations | Requires blockchain expertise; data interpretation can be complex | Relies on historical price, may be misleading in volatile markets |
| Best For | Crypto investors focusing on fundamental blockchain activity | Traders relying on price action and technical indicators |
Which is better?
On-chain analytics offers a data-driven approach by analyzing blockchain transactions, wallet activities, and network metrics, providing insights into market behavior backed by real-time, transparent data. Technical analysis relies on historical price charts, volume patterns, and indicators to predict future price movements based on past market trends. Combining both strategies often yields a more comprehensive understanding, as on-chain data reveals underlying blockchain fundamentals while technical analysis captures market sentiment and trading patterns.
Connection
On-chain analytics provides real-time blockchain data such as transaction volume, wallet activity, and network health, which enhances the accuracy of technical analysis in trading. By integrating on-chain metrics with price charts and indicators, traders gain a holistic view of market sentiment and potential trends. This synergy allows for more informed decision-making and risk management in cryptocurrency trading strategies.
Key Terms
**Technical Analysis:**
Technical analysis involves examining historical price charts, volume patterns, and market indicators to predict future asset movements, utilizing tools like moving averages and RSI. It relies heavily on price action and market psychology rather than fundamental data, making it a staple strategy for short-term traders and investors in cryptocurrency markets. Explore more about how technical analysis can sharpen your trading decisions and market timing techniques.
Chart Patterns
Chart patterns in technical analysis identify price movements and trends using historical market data, leveraging formations like head and shoulders or triangles to predict future price action. On-chain analytics enhance this approach by analyzing blockchain data such as transaction volumes, wallet activities, and token flows to validate or challenge chart signals. Explore how integrating technical chart patterns with on-chain metrics can refine your investment strategy.
Indicators
Technical analysis relies on indicators like moving averages, RSI, and MACD to predict future price trends based on historical market data, while on-chain analytics utilize blockchain data such as transaction volume, wallet activity, and network hash rate to assess asset behavior and network health. Technical indicators are useful for identifying short-term momentum and market sentiment, whereas on-chain metrics provide deeper insights into fundamental asset value and user activity. Explore the nuances of these tools to enhance your investment strategy.
Source and External Links
Technical Analysis - A Beginner's Guide - Corporate Finance Institute - Technical analysis predicts probable future price movement of a security by studying market data and price action, based on the premise that all market-relevant information is reflected in price movements and patterns.
Beginners Guide to Technical Analysis | Learn to Trade - Oanda - Technical analysis involves studying price charts to identify trends, support and resistance zones, and uses tools like moving averages and momentum indicators to determine high probability trades.
Technical analysis - Wikipedia - Technical analysis studies historical price data and trading patterns, based on principles that prices move in trends and market action discounts all information relevant to price, emphasizing repetitive investor behavior and trend identification.