Order flow footprint reveals detailed market transactions by displaying each trade's volume and price levels, enabling traders to identify buying and selling pressure with precision. Delta analysis measures the net difference between aggressive buying and selling orders, offering insights into market sentiment and potential reversals. Explore how combining order flow footprint and Delta analysis can enhance your trading strategy with deeper market understanding.
Why it is important
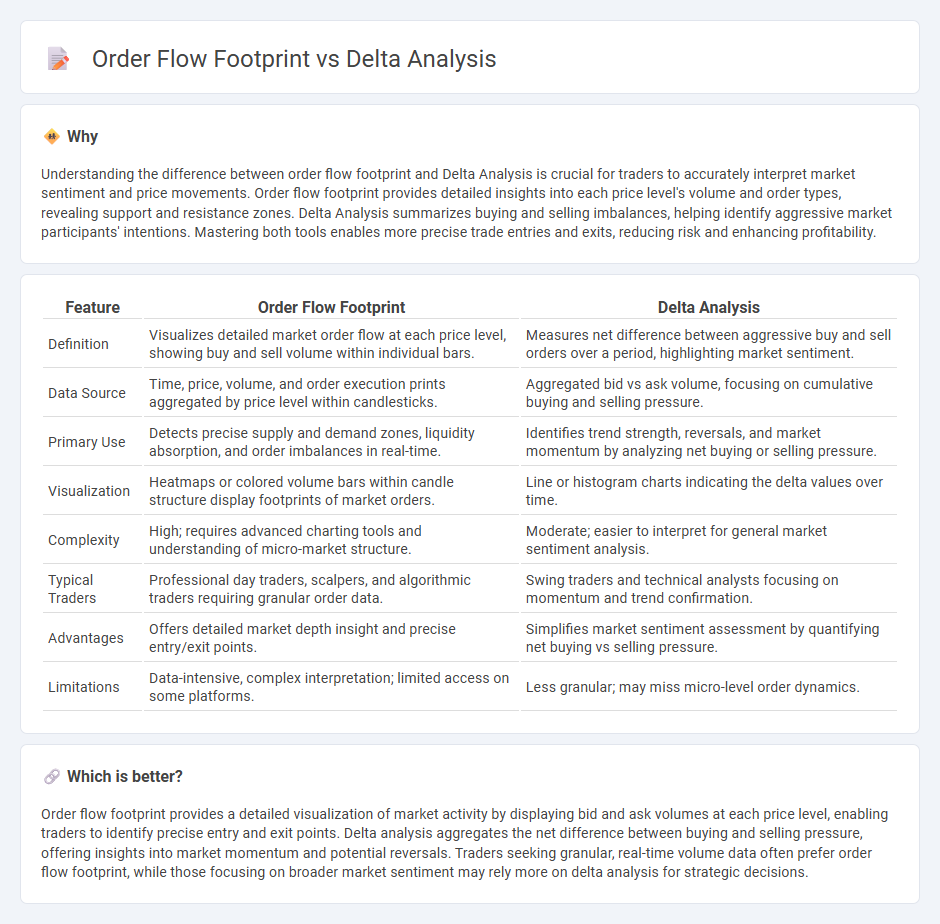
Understanding the difference between order flow footprint and Delta Analysis is crucial for traders to accurately interpret market sentiment and price movements. Order flow footprint provides detailed insights into each price level's volume and order types, revealing support and resistance zones. Delta Analysis summarizes buying and selling imbalances, helping identify aggressive market participants' intentions. Mastering both tools enables more precise trade entries and exits, reducing risk and enhancing profitability.
Comparison Table
| Feature | Order Flow Footprint | Delta Analysis |
|---|---|---|
| Definition | Visualizes detailed market order flow at each price level, showing buy and sell volume within individual bars. | Measures net difference between aggressive buy and sell orders over a period, highlighting market sentiment. |
| Data Source | Time, price, volume, and order execution prints aggregated by price level within candlesticks. | Aggregated bid vs ask volume, focusing on cumulative buying and selling pressure. |
| Primary Use | Detects precise supply and demand zones, liquidity absorption, and order imbalances in real-time. | Identifies trend strength, reversals, and market momentum by analyzing net buying or selling pressure. |
| Visualization | Heatmaps or colored volume bars within candle structure display footprints of market orders. | Line or histogram charts indicating the delta values over time. |
| Complexity | High; requires advanced charting tools and understanding of micro-market structure. | Moderate; easier to interpret for general market sentiment analysis. |
| Typical Traders | Professional day traders, scalpers, and algorithmic traders requiring granular order data. | Swing traders and technical analysts focusing on momentum and trend confirmation. |
| Advantages | Offers detailed market depth insight and precise entry/exit points. | Simplifies market sentiment assessment by quantifying net buying vs selling pressure. |
| Limitations | Data-intensive, complex interpretation; limited access on some platforms. | Less granular; may miss micro-level order dynamics. |
Which is better?
Order flow footprint provides a detailed visualization of market activity by displaying bid and ask volumes at each price level, enabling traders to identify precise entry and exit points. Delta analysis aggregates the net difference between buying and selling pressure, offering insights into market momentum and potential reversals. Traders seeking granular, real-time volume data often prefer order flow footprint, while those focusing on broader market sentiment may rely more on delta analysis for strategic decisions.
Connection
Order flow footprint and Delta Analysis are interconnected as both provide detailed insights into market participant behavior by analyzing executed trades and order imbalances. Order flow footprint charts display the volume of buy and sell orders at each price level, while Delta Analysis quantifies the net difference between aggressive buying and selling pressure, highlighting shifts in market sentiment. Together, they enhance traders' ability to identify momentum changes, potential reversals, and support or resistance zones with higher precision.
Key Terms
Delta Imbalance
Delta Imbalance measures the net difference between aggressive buying and selling within an order flow footprint, revealing market sentiment shifts more precisely than simple Delta Analysis. It provides a granular view of buying and selling pressure, helping traders identify potential reversals or continuation patterns in real time. Explore how mastering Delta Imbalance can enhance your trading strategy and improve decision-making accuracy.
Cumulative Delta
Cumulative Delta tracks the net difference between buying and selling pressure by aggregating the volume of trades at the bid and ask prices, offering a clear view of market sentiment over time. Unlike traditional Delta Analysis, the Order Flow Footprint provides detailed insights into trade executions at each price level, highlighting the intensity and directionality of trades within a specific candlestick or bar. Explore deeper into Cumulative Delta to gain precise control over trade timing and market entry strategies.
Bid-Ask Volume
Delta analysis measures net buying or selling pressure by calculating the difference between bid and ask volumes, providing insights into market momentum. Order flow footprint charts visualize bid and ask volume distribution at specific price levels, highlighting liquidity and potential support or resistance zones. Explore deeper nuances of bid-ask volume to enhance trading precision and market understanding.
Source and External Links
What is delta in statistics? Measuring change in experiments - Statsig - Delta in statistics refers to measuring differences or change between variables, often used in A/B testing and experiments to quantify treatment effects with methods like the Delta Method for variance estimation and hypothesis testing.
Delta Analysis - Ewon Online Help Center - Delta Analysis compares measurements between either two objects within the same time interval or one object over two equal time intervals, enabling analysis of differences (deltas) in data series for objects, areas, or organizational units.
The Delta Principle of Data Analysis - The Data Story Guide - The Delta Principle emphasizes comparing results with similar types of errors to focus on differences rather than absolute values, improving accuracy in analyses such as surveys by comparing sub-groups, time periods, benchmarks, or similar questions.