Liquidity sweeps identify large market orders that trigger price moves by absorbing available liquidity, signaling potential reversals or continuations. Volume clusters represent condensed areas of trading activity at specific price levels, revealing key support and resistance zones. Explore how integrating liquidity sweeps and volume clusters can enhance your trading strategy.
Why it is important
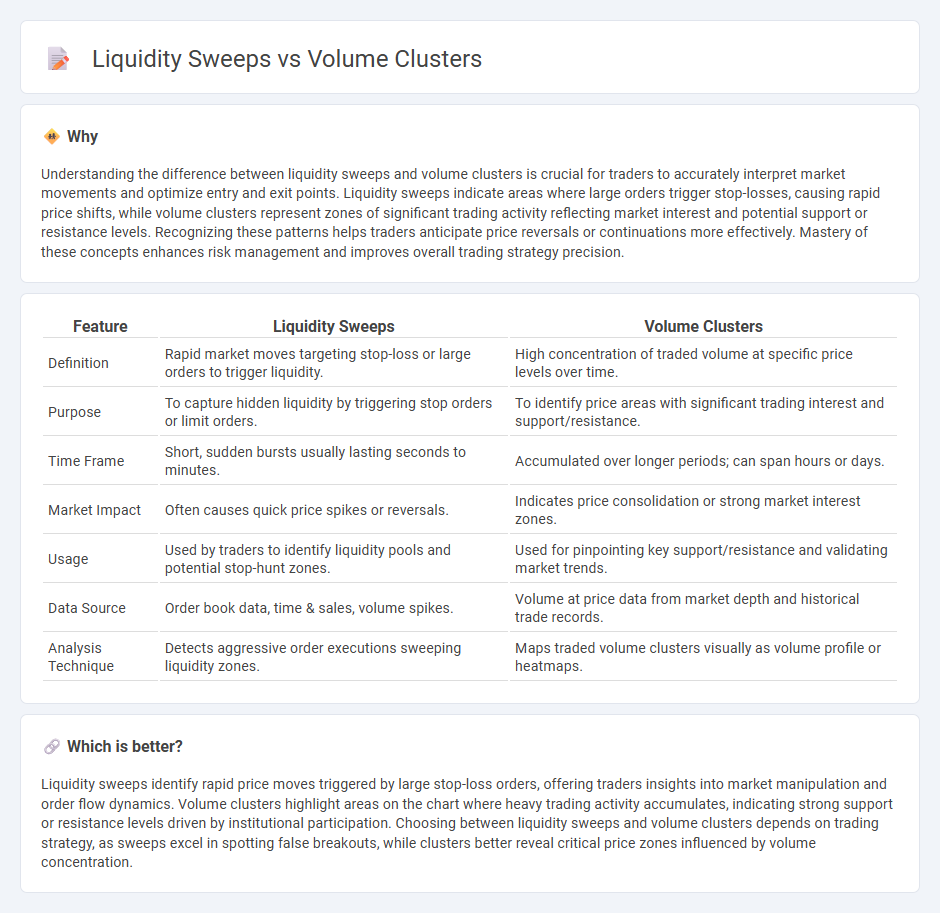
Understanding the difference between liquidity sweeps and volume clusters is crucial for traders to accurately interpret market movements and optimize entry and exit points. Liquidity sweeps indicate areas where large orders trigger stop-losses, causing rapid price shifts, while volume clusters represent zones of significant trading activity reflecting market interest and potential support or resistance levels. Recognizing these patterns helps traders anticipate price reversals or continuations more effectively. Mastery of these concepts enhances risk management and improves overall trading strategy precision.
Comparison Table
| Feature | Liquidity Sweeps | Volume Clusters |
|---|---|---|
| Definition | Rapid market moves targeting stop-loss or large orders to trigger liquidity. | High concentration of traded volume at specific price levels over time. |
| Purpose | To capture hidden liquidity by triggering stop orders or limit orders. | To identify price areas with significant trading interest and support/resistance. |
| Time Frame | Short, sudden bursts usually lasting seconds to minutes. | Accumulated over longer periods; can span hours or days. |
| Market Impact | Often causes quick price spikes or reversals. | Indicates price consolidation or strong market interest zones. |
| Usage | Used by traders to identify liquidity pools and potential stop-hunt zones. | Used for pinpointing key support/resistance and validating market trends. |
| Data Source | Order book data, time & sales, volume spikes. | Volume at price data from market depth and historical trade records. |
| Analysis Technique | Detects aggressive order executions sweeping liquidity zones. | Maps traded volume clusters visually as volume profile or heatmaps. |
Which is better?
Liquidity sweeps identify rapid price moves triggered by large stop-loss orders, offering traders insights into market manipulation and order flow dynamics. Volume clusters highlight areas on the chart where heavy trading activity accumulates, indicating strong support or resistance levels driven by institutional participation. Choosing between liquidity sweeps and volume clusters depends on trading strategy, as sweeps excel in spotting false breakouts, while clusters better reveal critical price zones influenced by volume concentration.
Connection
Liquidity sweeps occur when large orders trigger stop-losses or limit orders, causing rapid price movement and increased trading activity within volume clusters. Volume clusters represent areas where high trading volumes accumulate at specific price levels, reflecting significant market interest and liquidity pools. The interaction between liquidity sweeps and volume clusters reveals key market dynamics, as sweeps exploit these clusters to execute large trades with minimal price disruption.
Key Terms
Order Book
Volume clusters reveal concentrations of trading activity at specific price levels, highlighting areas of strong demand or supply within the order book. Liquidity sweeps occur when large market orders aggressively consume resting limit orders, rapidly moving through multiple price levels and indicating potential stop-loss hunting or institutional participation. Explore deeper insights into order book dynamics by analyzing how volume clusters and liquidity sweeps interact in real-time market conditions.
Trade Imbalance
Volume clusters represent concentrated trading activity at specific price levels, revealing zones of strong buying or selling interest. Liquidity sweeps occur when large orders trigger stop-losses or pending orders, disrupting the trade imbalance by rapidly consuming available liquidity. Explore deeper insights into how Trade Imbalance dynamics influence market entries and exits.
Market Depth
Volume clusters identify concentrations of trading activity at specific price levels, revealing areas of strong support and resistance within market depth. Liquidity sweeps occur when large orders swiftly consume available liquidity across multiple price levels, often triggering stop orders and accelerating market movement. Explore detailed analysis to understand how these concepts influence trading strategies and market dynamics.
Source and External Links
Volume Clusters in Order Flow Charts - YouTube - Volume clusters represent concentrated zones of trading volume in order flow charts, serving as important indicators for support, resistance, and trading strategies in market profile and volume analysis.
Volume Lash Clusters - LULUBEAUTY - Volume Lash Clusters are handcrafted eyelash groups designed to add dramatic intensity and fullness to natural lashes, available in various lengths and styled for a natural extension look.
imPRESS Falsies Self Adhesive Eyelashes, 12 Lash Clusters - Bold - These are self-adhesive eyelash clusters that provide a bold volume look, designed for quick application and removal without glue, offering a seamless and customizable lash style.