Social sentiment analysis trading leverages real-time data from social media platforms and news sources to gauge market sentiment and predict price movements. Technical analysis trading relies on historical price charts and volume patterns to identify trends and make informed decisions. Explore the strengths and applications of both methods to enhance your trading strategy.
Why it is important
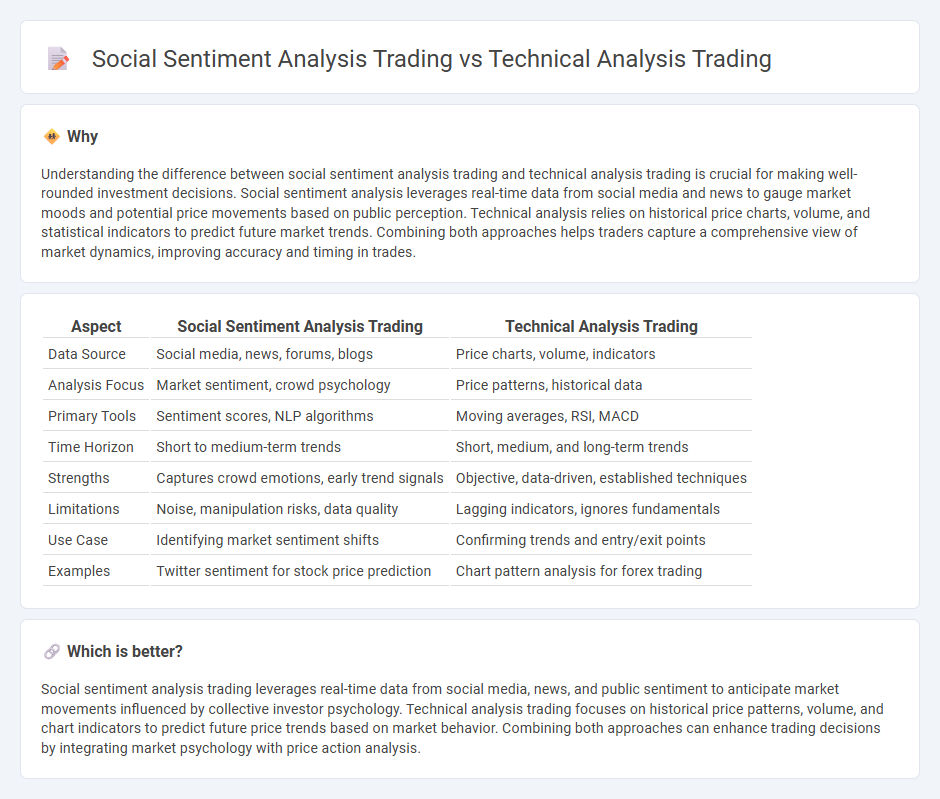
Understanding the difference between social sentiment analysis trading and technical analysis trading is crucial for making well-rounded investment decisions. Social sentiment analysis leverages real-time data from social media and news to gauge market moods and potential price movements based on public perception. Technical analysis relies on historical price charts, volume, and statistical indicators to predict future market trends. Combining both approaches helps traders capture a comprehensive view of market dynamics, improving accuracy and timing in trades.
Comparison Table
| Aspect | Social Sentiment Analysis Trading | Technical Analysis Trading |
|---|---|---|
| Data Source | Social media, news, forums, blogs | Price charts, volume, indicators |
| Analysis Focus | Market sentiment, crowd psychology | Price patterns, historical data |
| Primary Tools | Sentiment scores, NLP algorithms | Moving averages, RSI, MACD |
| Time Horizon | Short to medium-term trends | Short, medium, and long-term trends |
| Strengths | Captures crowd emotions, early trend signals | Objective, data-driven, established techniques |
| Limitations | Noise, manipulation risks, data quality | Lagging indicators, ignores fundamentals |
| Use Case | Identifying market sentiment shifts | Confirming trends and entry/exit points |
| Examples | Twitter sentiment for stock price prediction | Chart pattern analysis for forex trading |
Which is better?
Social sentiment analysis trading leverages real-time data from social media, news, and public sentiment to anticipate market movements influenced by collective investor psychology. Technical analysis trading focuses on historical price patterns, volume, and chart indicators to predict future price trends based on market behavior. Combining both approaches can enhance trading decisions by integrating market psychology with price action analysis.
Connection
Social sentiment analysis trading leverages data from social media and news to gauge market mood, which can signal potential price movements. Technical analysis trading focuses on historical price patterns and volume trends to predict future market behavior. Combining both approaches enhances decision-making by integrating market psychology insights with objective chart-based indicators.
Key Terms
Technical analysis trading:
Technical analysis trading relies on historical price data, charts, and indicators like moving averages and Relative Strength Index (RSI) to predict future market trends and identify entry and exit points. Traders use patterns such as head and shoulders, support and resistance levels, and volume analysis to make informed decisions. Explore how integrating advanced technical tools can enhance your trading strategy and market timing.
Chart Patterns
Technical analysis trading relies on chart patterns such as head and shoulders, double tops, and triangles to predict price movements by analyzing historical price data and volume trends. Social sentiment analysis trading leverages real-time data from social media, forums, and news sources to gauge market sentiment and identify potential trading opportunities based on crowd psychology. Explore how integrating chart pattern recognition with sentiment analysis can enhance trading strategies for deeper market insights.
Indicators (e.g., RSI, MACD)
Technical analysis trading uses indicators like RSI and MACD to identify market trends and momentum by analyzing historical price and volume data. Social sentiment analysis trading evaluates emotions and opinions from social media and news sources to predict potential market movements based on crowd psychology. Explore the strengths and applications of both methods to enhance your trading strategy.
Source and External Links
Technical Analysis - A Beginner's Guide - Corporate Finance Institute - Technical analysis is a method used to predict future price movements of securities by analyzing past market data and price charts, with traders selecting time frames and indicators based on their trading style to identify trends and entry points.
Technical analysis - Wikipedia - It is based on the principle that market prices reflect all relevant information and tend to move in trends, so technical analysts study historical price patterns and trends rather than external events to forecast future price direction.
Technical Analysis: Getting Started (PDF) - Babson College - Technical analysis involves using historical price data and current price action, often visualized through candlestick charts, to identify signals and patterns in market psychology for timing trades and catching trend reversals.