Order flow footprint reveals detailed buying and selling pressure by displaying real-time bid and ask volumes at each price level, giving traders a granular view of market dynamics. Tape reading analyzes the stream of time and sales data to identify large transactions and momentum shifts, helping predict short-term price movement. Discover how mastering both techniques can enhance your trading precision and decision-making.
Why it is important
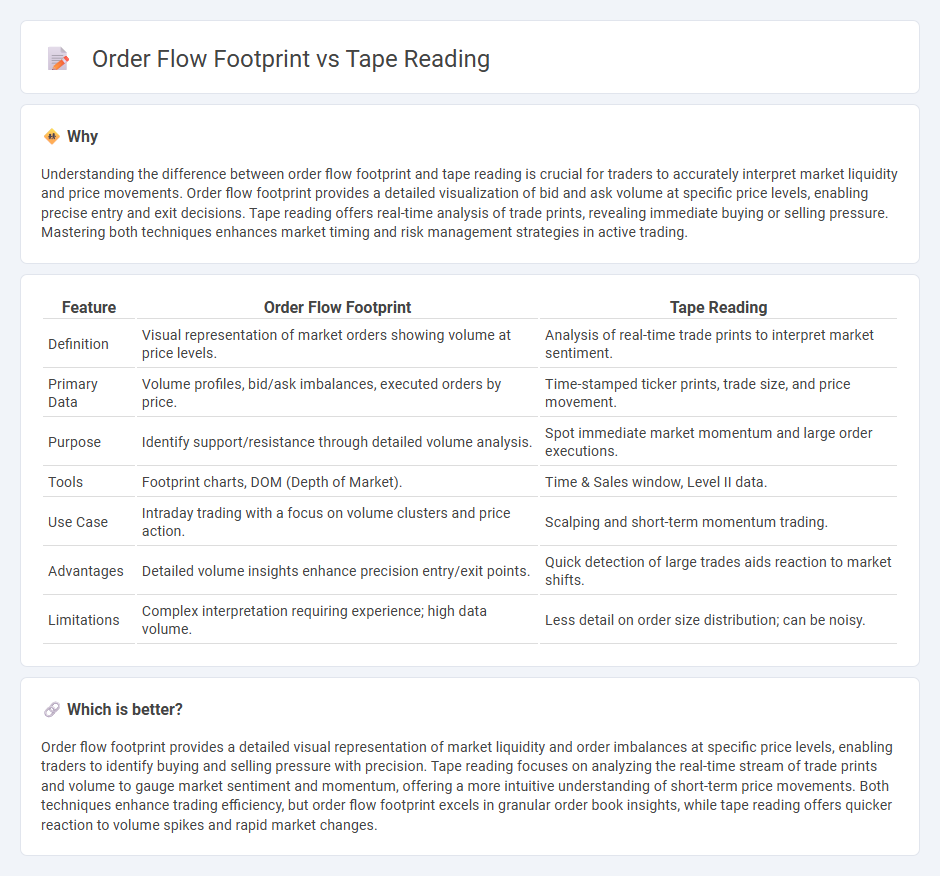
Understanding the difference between order flow footprint and tape reading is crucial for traders to accurately interpret market liquidity and price movements. Order flow footprint provides a detailed visualization of bid and ask volume at specific price levels, enabling precise entry and exit decisions. Tape reading offers real-time analysis of trade prints, revealing immediate buying or selling pressure. Mastering both techniques enhances market timing and risk management strategies in active trading.
Comparison Table
| Feature | Order Flow Footprint | Tape Reading |
|---|---|---|
| Definition | Visual representation of market orders showing volume at price levels. | Analysis of real-time trade prints to interpret market sentiment. |
| Primary Data | Volume profiles, bid/ask imbalances, executed orders by price. | Time-stamped ticker prints, trade size, and price movement. |
| Purpose | Identify support/resistance through detailed volume analysis. | Spot immediate market momentum and large order executions. |
| Tools | Footprint charts, DOM (Depth of Market). | Time & Sales window, Level II data. |
| Use Case | Intraday trading with a focus on volume clusters and price action. | Scalping and short-term momentum trading. |
| Advantages | Detailed volume insights enhance precision entry/exit points. | Quick detection of large trades aids reaction to market shifts. |
| Limitations | Complex interpretation requiring experience; high data volume. | Less detail on order size distribution; can be noisy. |
Which is better?
Order flow footprint provides a detailed visual representation of market liquidity and order imbalances at specific price levels, enabling traders to identify buying and selling pressure with precision. Tape reading focuses on analyzing the real-time stream of trade prints and volume to gauge market sentiment and momentum, offering a more intuitive understanding of short-term price movements. Both techniques enhance trading efficiency, but order flow footprint excels in granular order book insights, while tape reading offers quicker reaction to volume spikes and rapid market changes.
Connection
Order flow footprint and Tape Reading are intrinsically connected through their focus on real-time market data analysis to gauge buying and selling pressure. Order flow footprint charts provide detailed visual representations of trade volume at specific price levels, revealing the intensity and direction of market participants' actions. Tape Reading complements this by interpreting the raw time and sales data, offering insights into the speed, size, and sequence of trades that influence short-term price movements.
Key Terms
Time and Sales
Tape reading analyzes Time and Sales data to monitor real-time trade executions, highlighting volume, price, and trade speed for short-term market sentiment insights. Order flow footprint charts provide a detailed visual representation of buy and sell orders at each price level, revealing liquidity imbalances and market depth beyond just Time and Sales. Explore the differences and applications of these tools to enhance your trading strategy precision.
Cumulative Delta
Cumulative Delta measures net buying and selling pressure by analyzing the volume difference between market buy and sell orders, providing insights that enhance tape reading techniques. Unlike traditional tape reading, order flow footprint charts visualize price, volume, and order aggressiveness across specific price levels, allowing traders to interpret market sentiment more precisely. Explore deeper into how Cumulative Delta integrates into these methods to refine trading decisions.
Bid-Ask Imbalance
Tape reading involves analyzing real-time trade prints and price movements to gauge market sentiment, while order flow footprint charts display bid-ask imbalance by highlighting executed buy and sell orders at each price level. Bid-ask imbalance is crucial for identifying potential support and resistance zones, providing traders with insights into market strength and possible reversal points. Explore deeper into how bid-ask imbalance enhances trading strategies by uncovering hidden market dynamics.
Source and External Links
The Ultimate Tape Reading Guide: How to Interpret Time and Sales - Tape reading involves interpreting real-time price and volume data from transactions to gauge market sentiment and predict price movements, originating from the old ticker tape system but now done via digital time and sales data on trading platforms.
What Is Tape Reading and How Does It Work - Earn2Trade Blog - Tape reading is a technique dating back to the late 1860s where traders analyze price and trade volume data, often identifying support and resistance levels by observing large limit orders and market activity to plan their trades.
What is Tape Reading Today? - Bookmap - Modern tape reading refers to observing the Time & Sales or transactions data showing timestamp, price, and volume in real time, enabling traders to infer order flow and market dynamics beyond just executed trades.