Volume profile reading provides a detailed map of traded volumes at specific price levels, revealing key areas of market interest and price acceptance that often coincide with support and resistance zones. Support and resistance levels identify price points where buying or selling pressure historically changes, but lack the depth of volume data that volume profile offers to validate these zones. Explore how combining volume profile analysis with traditional support and resistance improves trade timing and market insight.
Why it is important
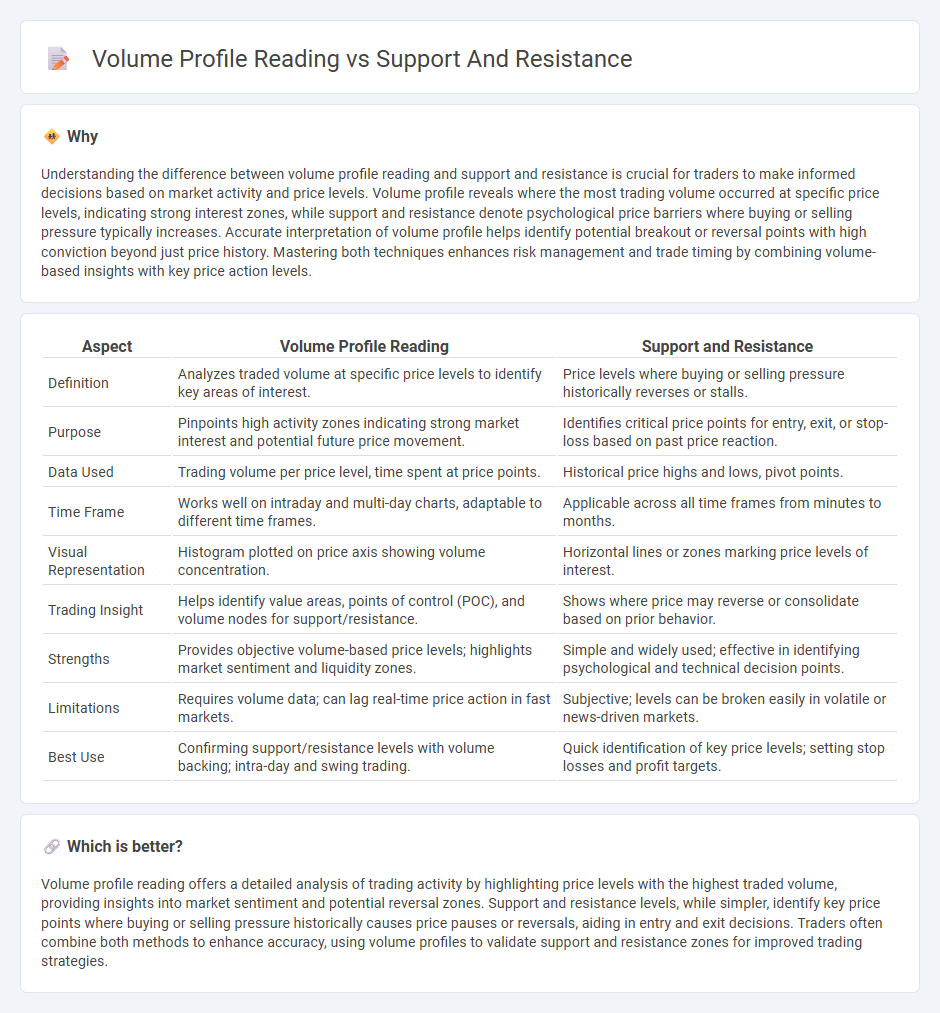
Understanding the difference between volume profile reading and support and resistance is crucial for traders to make informed decisions based on market activity and price levels. Volume profile reveals where the most trading volume occurred at specific price levels, indicating strong interest zones, while support and resistance denote psychological price barriers where buying or selling pressure typically increases. Accurate interpretation of volume profile helps identify potential breakout or reversal points with high conviction beyond just price history. Mastering both techniques enhances risk management and trade timing by combining volume-based insights with key price action levels.
Comparison Table
| Aspect | Volume Profile Reading | Support and Resistance |
|---|---|---|
| Definition | Analyzes traded volume at specific price levels to identify key areas of interest. | Price levels where buying or selling pressure historically reverses or stalls. |
| Purpose | Pinpoints high activity zones indicating strong market interest and potential future price movement. | Identifies critical price points for entry, exit, or stop-loss based on past price reaction. |
| Data Used | Trading volume per price level, time spent at price points. | Historical price highs and lows, pivot points. |
| Time Frame | Works well on intraday and multi-day charts, adaptable to different time frames. | Applicable across all time frames from minutes to months. |
| Visual Representation | Histogram plotted on price axis showing volume concentration. | Horizontal lines or zones marking price levels of interest. |
| Trading Insight | Helps identify value areas, points of control (POC), and volume nodes for support/resistance. | Shows where price may reverse or consolidate based on prior behavior. |
| Strengths | Provides objective volume-based price levels; highlights market sentiment and liquidity zones. | Simple and widely used; effective in identifying psychological and technical decision points. |
| Limitations | Requires volume data; can lag real-time price action in fast markets. | Subjective; levels can be broken easily in volatile or news-driven markets. |
| Best Use | Confirming support/resistance levels with volume backing; intra-day and swing trading. | Quick identification of key price levels; setting stop losses and profit targets. |
Which is better?
Volume profile reading offers a detailed analysis of trading activity by highlighting price levels with the highest traded volume, providing insights into market sentiment and potential reversal zones. Support and resistance levels, while simpler, identify key price points where buying or selling pressure historically causes price pauses or reversals, aiding in entry and exit decisions. Traders often combine both methods to enhance accuracy, using volume profiles to validate support and resistance zones for improved trading strategies.
Connection
Volume profile reading identifies price levels with high trading activity, highlighting key areas of support and resistance where buyers and sellers frequently engage. These levels often correspond to price zones where market momentum slows or reverses, providing traders with critical insights into potential entry and exit points. Understanding the interplay between volume distribution and support/resistance enhances decision-making accuracy in trading strategies.
Key Terms
**Support and Resistance:**
Support and resistance levels represent key price points where buying or selling pressure historically prevents further price movement, often identified using horizontal lines on charts. These levels are crucial for traders to determine entry and exit points, as prices frequently bounce or reverse at these zones. Discover how combining support and resistance with volume profile reading enhances market analysis and decision-making strategies.
Price Levels
Support and resistance levels represent key price points where buying or selling pressure historically alters market direction, while volume profile reading reveals the distribution of traded volume at various price levels, highlighting areas of significant market activity and potential liquidity zones. Understanding the interplay between these price levels and volume concentrations enhances precision in identifying strong support and resistance zones. Explore more to master how integrating volume profile with price levels sharpens trading strategies.
Breakout
Support and resistance levels indicate price points where buying or selling pressure historically reverses, while volume profile reading reveals the distribution of traded volume at various price levels, highlighting areas of market consensus or rejection. During a breakout, volume profile helps confirm the strength by showing increased volume beyond established support or resistance zones, signaling genuine market interest rather than a false move. Explore how combining support and resistance analysis with volume profile insights enhances breakout trading strategies for more accurate market entries.
Source and External Links
What Is Support And Resistance? - Support is the price level where demand is strong enough to prevent further decline, acting as a floor, while resistance is the price level at which supply is strong enough to prevent price from rising, acting as a ceiling; these levels represent key points where supply and demand forces interact and can change market direction.
What is Support and Resistance? - Support and resistance are fundamental concepts in technical analysis, where support acts as a price floor created by buying interest, and resistance acts as a price ceiling created by selling pressure, both helping traders identify potential entry and exit points based on price action.
What Are Support and Resistance & How To Use Them - Support and resistance levels reflect the interaction of supply and demand that determine price movement; when price breaks these levels in a breakout, the old resistance can become new support and vice versa, indicating potential trend shifts and trading opportunities.