Quantitative momentum leverages statistical models and algorithms to identify securities with strong price trends based on historical performance data, focusing on measurable momentum factors. Technical analysis relies on chart patterns, price movements, and volume indicators to predict future price directions, emphasizing visual tools and market psychology. Explore deeper insights into how these distinct trading strategies can optimize investment decisions.
Why it is important
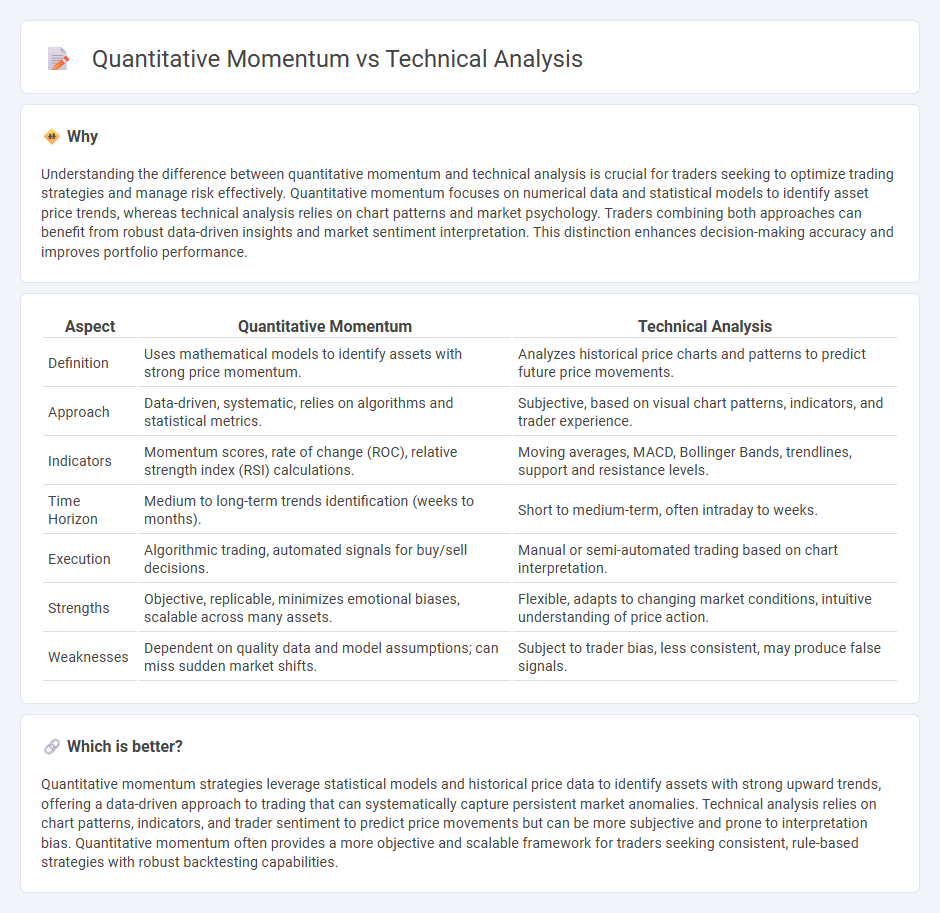
Understanding the difference between quantitative momentum and technical analysis is crucial for traders seeking to optimize trading strategies and manage risk effectively. Quantitative momentum focuses on numerical data and statistical models to identify asset price trends, whereas technical analysis relies on chart patterns and market psychology. Traders combining both approaches can benefit from robust data-driven insights and market sentiment interpretation. This distinction enhances decision-making accuracy and improves portfolio performance.
Comparison Table
| Aspect | Quantitative Momentum | Technical Analysis |
|---|---|---|
| Definition | Uses mathematical models to identify assets with strong price momentum. | Analyzes historical price charts and patterns to predict future price movements. |
| Approach | Data-driven, systematic, relies on algorithms and statistical metrics. | Subjective, based on visual chart patterns, indicators, and trader experience. |
| Indicators | Momentum scores, rate of change (ROC), relative strength index (RSI) calculations. | Moving averages, MACD, Bollinger Bands, trendlines, support and resistance levels. |
| Time Horizon | Medium to long-term trends identification (weeks to months). | Short to medium-term, often intraday to weeks. |
| Execution | Algorithmic trading, automated signals for buy/sell decisions. | Manual or semi-automated trading based on chart interpretation. |
| Strengths | Objective, replicable, minimizes emotional biases, scalable across many assets. | Flexible, adapts to changing market conditions, intuitive understanding of price action. |
| Weaknesses | Dependent on quality data and model assumptions; can miss sudden market shifts. | Subject to trader bias, less consistent, may produce false signals. |
Which is better?
Quantitative momentum strategies leverage statistical models and historical price data to identify assets with strong upward trends, offering a data-driven approach to trading that can systematically capture persistent market anomalies. Technical analysis relies on chart patterns, indicators, and trader sentiment to predict price movements but can be more subjective and prone to interpretation bias. Quantitative momentum often provides a more objective and scalable framework for traders seeking consistent, rule-based strategies with robust backtesting capabilities.
Connection
Quantitative momentum integrates statistical techniques to measure asset price trends, enhancing traditional technical analysis methods that focus on price patterns and volume. These approaches collectively identify momentum-driven trading opportunities by analyzing historical price data and momentum indicators like moving averages and relative strength index (RSI). Employing both frameworks improves prediction accuracy and risk management in trading strategies.
Key Terms
**Technical Analysis:**
Technical analysis involves examining historical price charts, volume patterns, and indicators like moving averages and RSI to predict future market movements. It relies on identifying trends, support and resistance levels, and chart patterns to guide trading decisions. Explore more about how technical analysis can enhance your investment strategy.
Support and Resistance
Support and resistance levels are fundamental in technical analysis, helping traders identify potential price reversal points by analyzing historical price trends and volume data. Quantitative momentum strategies, however, apply mathematical models to measure price velocity and strength, often incorporating support and resistance as variables within algorithmic frameworks to optimize trade entries and exits. Explore how integrating these approaches can enhance your market timing and risk management techniques.
Moving Averages
Technical analysis employs moving averages to identify trend direction and potential support or resistance levels by smoothing price data over specific periods. Quantitative momentum strategies utilize moving averages to generate buy or sell signals based on the speed and strength of price movements, often integrating mathematical models to optimize timing. Discover how moving averages drive predictive power in both approaches for enhanced trading decisions.
Source and External Links
Technical analysis - Wikipedia - A method for analyzing and forecasting price direction by studying past market data, especially price trends and patterns, based on the premise that market prices reflect all relevant information and tend to move in trends.
Technical Analysis - A Beginner's Guide - Corporate Finance Institute - A method used to predict future price movement of securities by analyzing past price action, relying on price charts and technical indicators across different time frames suited to various trading styles.
Beginners Guide to Technical Analysis | Learn to Trade - Oanda - Explains how technical analysts study historical price charts to identify trends, support and resistance levels, and use tools like moving averages and momentum indicators to make high-probability trading decisions.