High-frequency tick charts capture each trade event in real-time, offering granular insight into market micro-movements driven by specific trade volumes, ideal for scalpers and algorithmic traders. Renko charts filter out market noise by focusing solely on price movements that exceed a predefined threshold, providing clearer trend signals and reducing emotional trading decisions. Explore the advantages and strategic applications of both chart types to enhance your trading precision.
Why it is important
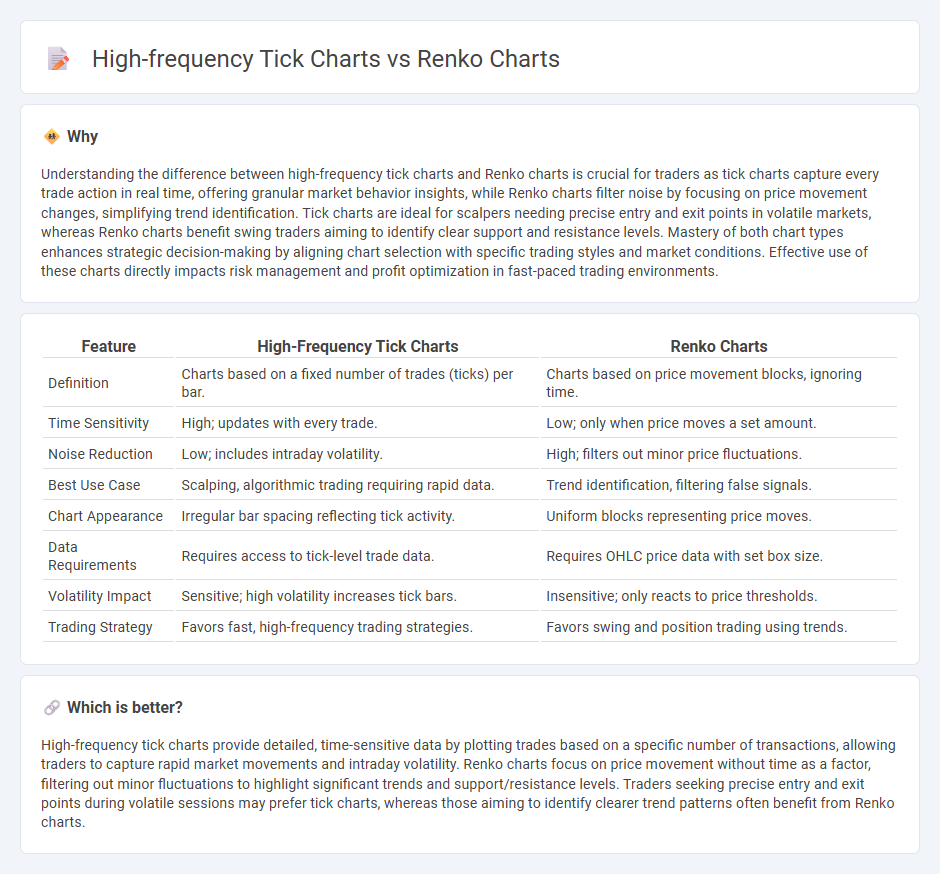
Understanding the difference between high-frequency tick charts and Renko charts is crucial for traders as tick charts capture every trade action in real time, offering granular market behavior insights, while Renko charts filter noise by focusing on price movement changes, simplifying trend identification. Tick charts are ideal for scalpers needing precise entry and exit points in volatile markets, whereas Renko charts benefit swing traders aiming to identify clear support and resistance levels. Mastery of both chart types enhances strategic decision-making by aligning chart selection with specific trading styles and market conditions. Effective use of these charts directly impacts risk management and profit optimization in fast-paced trading environments.
Comparison Table
| Feature | High-Frequency Tick Charts | Renko Charts |
|---|---|---|
| Definition | Charts based on a fixed number of trades (ticks) per bar. | Charts based on price movement blocks, ignoring time. |
| Time Sensitivity | High; updates with every trade. | Low; only when price moves a set amount. |
| Noise Reduction | Low; includes intraday volatility. | High; filters out minor price fluctuations. |
| Best Use Case | Scalping, algorithmic trading requiring rapid data. | Trend identification, filtering false signals. |
| Chart Appearance | Irregular bar spacing reflecting tick activity. | Uniform blocks representing price moves. |
| Data Requirements | Requires access to tick-level trade data. | Requires OHLC price data with set box size. |
| Volatility Impact | Sensitive; high volatility increases tick bars. | Insensitive; only reacts to price thresholds. |
| Trading Strategy | Favors fast, high-frequency trading strategies. | Favors swing and position trading using trends. |
Which is better?
High-frequency tick charts provide detailed, time-sensitive data by plotting trades based on a specific number of transactions, allowing traders to capture rapid market movements and intraday volatility. Renko charts focus on price movement without time as a factor, filtering out minor fluctuations to highlight significant trends and support/resistance levels. Traders seeking precise entry and exit points during volatile sessions may prefer tick charts, whereas those aiming to identify clearer trend patterns often benefit from Renko charts.
Connection
High-frequency tick charts and Renko charts both focus on price movement rather than time intervals, enabling traders to capture market trends more effectively. High-frequency tick charts plot each trade or a fixed number of trades, emphasizing market activity intensity, while Renko charts filter out noise by constructing bricks based on price changes of a specified size. Combining these chart types allows traders to analyze rapid price fluctuations alongside smoothed trend patterns for improved trading decisions.
Key Terms
Price Action
Renko charts emphasize clear price action by filtering out minor market noise and focusing on significant price movements, making trend identification straightforward. High-frequency tick charts capture every market tick, providing granular and real-time price data essential for scalpers and algorithmic traders seeking precise entry and exit points. Explore detailed comparisons to enhance your trading strategy with the right price action tools.
Time Independence
Renko charts prioritize price movement by filtering out time and volume noise, creating blocks only when a specific price change occurs, making them highly time-independent and ideal for identifying clear trends in volatile markets. High-frequency tick charts, on the other hand, capture every individual trade regardless of time intervals, emphasizing trade activity intensity but still tied to transaction occurrences rather than consistent timeframes. Explore further to understand how these charting techniques impact trading strategies and market analysis.
Trade Frequency
Renko charts filter out market noise by focusing solely on price movement thresholds, resulting in fewer but more significant trade signals compared to high-frequency tick charts, which capture every market tick and generate numerous trades per minute. This difference in trade frequency impacts execution strategies, with Renko charts favoring strategic, less frequent trades and high-frequency tick charts suiting active traders who rely on rapid trade execution and high-volume data. Explore how adjusting trade frequency based on chart type can enhance your trading efficiency and decision-making.
Source and External Links
Renko chart - Wikipedia - A Renko chart is a Japanese-origin financial chart used in technical analysis that plots price changes through bricks of predetermined size to highlight market trends and reduce noise compared to standard candlestick charts, without considering time intervals.
Understanding Renko charts - TradingView - Renko charts consist of bricks added only when price moves a predetermined amount, with rules ensuring bricks touch corners and never stack vertically more than once per column, focusing solely on price fluctuations rather than time.
Tips for using Renko charts in your trading | Technical Analysis - Renko charts plot new bricks based on fixed price movements: continuation in the same direction requires one brick size movement, while a reversal needs a movement twice the brick size; they have no timeframe, so brick formation depends entirely on volatility and price changes.