Footprint charts display detailed price action by illustrating volume traded at each price level, offering granular insight into market dynamics. Order flow charts emphasize the real-time buying and selling pressure by tracking actual market orders and trades, helping traders identify potential reversals and trends. Explore the nuances of footprint charts vs. order flow charts to enhance your trading strategy and market analysis.
Why it is important
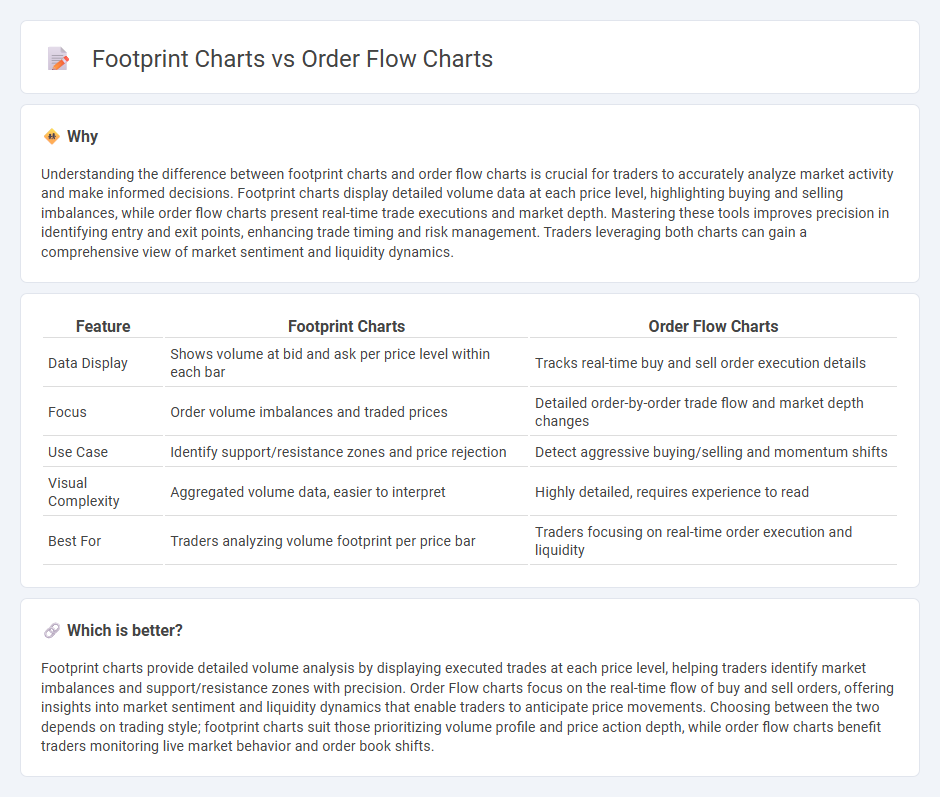
Understanding the difference between footprint charts and order flow charts is crucial for traders to accurately analyze market activity and make informed decisions. Footprint charts display detailed volume data at each price level, highlighting buying and selling imbalances, while order flow charts present real-time trade executions and market depth. Mastering these tools improves precision in identifying entry and exit points, enhancing trade timing and risk management. Traders leveraging both charts can gain a comprehensive view of market sentiment and liquidity dynamics.
Comparison Table
| Feature | Footprint Charts | Order Flow Charts |
|---|---|---|
| Data Display | Shows volume at bid and ask per price level within each bar | Tracks real-time buy and sell order execution details |
| Focus | Order volume imbalances and traded prices | Detailed order-by-order trade flow and market depth changes |
| Use Case | Identify support/resistance zones and price rejection | Detect aggressive buying/selling and momentum shifts |
| Visual Complexity | Aggregated volume data, easier to interpret | Highly detailed, requires experience to read |
| Best For | Traders analyzing volume footprint per price bar | Traders focusing on real-time order execution and liquidity |
Which is better?
Footprint charts provide detailed volume analysis by displaying executed trades at each price level, helping traders identify market imbalances and support/resistance zones with precision. Order Flow charts focus on the real-time flow of buy and sell orders, offering insights into market sentiment and liquidity dynamics that enable traders to anticipate price movements. Choosing between the two depends on trading style; footprint charts suit those prioritizing volume profile and price action depth, while order flow charts benefit traders monitoring live market behavior and order book shifts.
Connection
Footprint charts visualize detailed trade executions by displaying volume at each price level, revealing market participant activity, while Order Flow charts track real-time buying and selling pressure through bid and ask orders. Both chart types provide granular insights into market liquidity and order dynamics, enabling traders to analyze imbalances and identify potential reversals. Their integration enhances precise entry and exit decisions by combining executed trade data with order book information.
Key Terms
Market Depth
Order Flow charts provide a detailed view of executed trades, highlighting bid and ask volumes to reveal real-time buying and selling pressure. Footprint charts combine price, volume, and order flow data within each price bar to visualize market depth and price movements more intuitively. Explore the nuances of Market Depth analysis by diving deeper into how these charts enhance trading strategies and decision-making.
Volume Delta
Order Flow charts display real-time buy and sell volume, highlighting market aggressiveness through bid and ask transactions, while Footprint charts break down volume at each price level, emphasizing Volume Delta to reveal buying and selling pressure within candlesticks. Volume Delta, the difference between aggressive buying and selling volume, serves as a crucial indicator on Footprint charts, providing traders with precise insight into market sentiment and potential reversals. Explore deeper analysis on how Volume Delta enhances trading strategies with Footprint charts for more informed decision-making.
Trade Imbalance
Order Flow charts visualize market transactions by displaying the sequence and volume of trades at each price level, helping traders identify buying and selling pressure. Footprint charts enhance this by showing trade imbalances through bid and ask volumes, highlighting precise areas where aggressive buying or selling occurs. Explore the detailed comparison to understand how trade imbalance analysis improves order flow strategies.
Source and External Links
Order Flow Trading & Volumetric Bars - Order flow charts visualize buying and selling pressure tick by tick using volumetric bars, volume profile, cumulative delta, and VWAP to identify market trends, volume clusters, and support/resistance levels for precise trade analysis.
Order Flow Trading Platform for Stock Traders - Bookmap provides advanced order flow charts that show real-time market depth, liquidity, and order book imbalances, allowing traders to see buyer/seller intentions beyond traditional candlestick charts.
Order Flow Trading for TVC:GOLD by samstoobad - Order flow charts use tools like footprint charts and volume profiles to indicate large buyer/seller activity and key price levels, enhancing the understanding of price direction and institutional order placement.