Footprint charts provide detailed order flow information by displaying the volume of trades at each price level, allowing traders to analyze market sentiment and liquidity with precision. Heikin Ashi charts smooth price data by averaging, highlighting trends and reducing market noise for clearer visual insights. Explore the differences to enhance your trading strategy and decision-making.
Why it is important
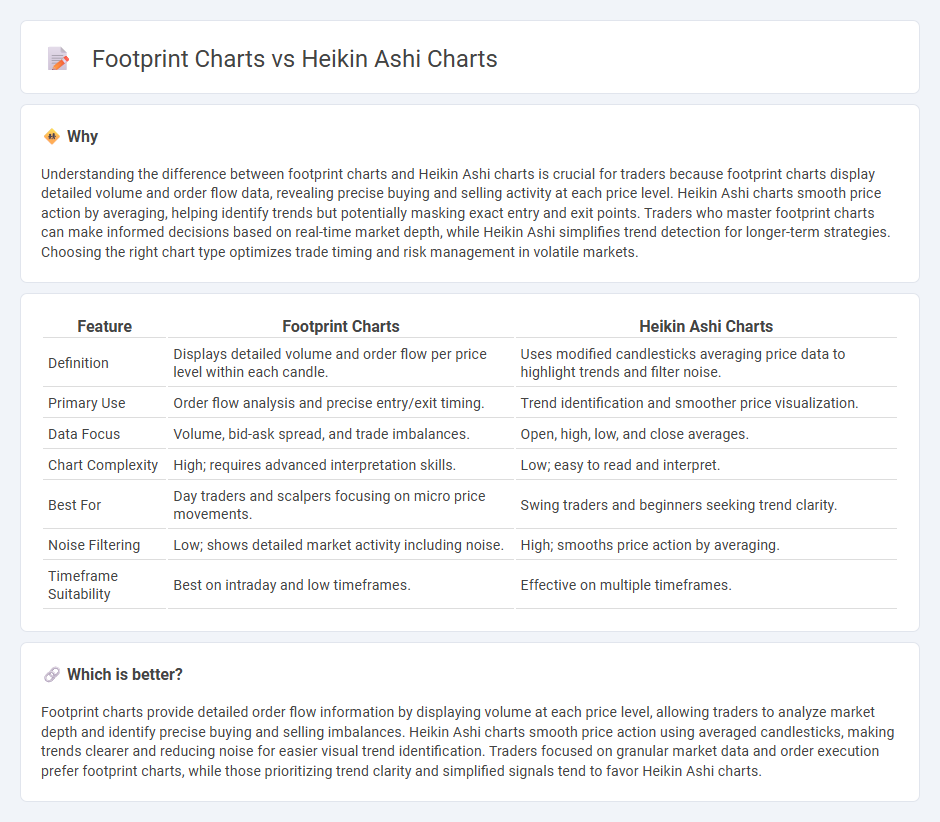
Understanding the difference between footprint charts and Heikin Ashi charts is crucial for traders because footprint charts display detailed volume and order flow data, revealing precise buying and selling activity at each price level. Heikin Ashi charts smooth price action by averaging, helping identify trends but potentially masking exact entry and exit points. Traders who master footprint charts can make informed decisions based on real-time market depth, while Heikin Ashi simplifies trend detection for longer-term strategies. Choosing the right chart type optimizes trade timing and risk management in volatile markets.
Comparison Table
| Feature | Footprint Charts | Heikin Ashi Charts |
|---|---|---|
| Definition | Displays detailed volume and order flow per price level within each candle. | Uses modified candlesticks averaging price data to highlight trends and filter noise. |
| Primary Use | Order flow analysis and precise entry/exit timing. | Trend identification and smoother price visualization. |
| Data Focus | Volume, bid-ask spread, and trade imbalances. | Open, high, low, and close averages. |
| Chart Complexity | High; requires advanced interpretation skills. | Low; easy to read and interpret. |
| Best For | Day traders and scalpers focusing on micro price movements. | Swing traders and beginners seeking trend clarity. |
| Noise Filtering | Low; shows detailed market activity including noise. | High; smooths price action by averaging. |
| Timeframe Suitability | Best on intraday and low timeframes. | Effective on multiple timeframes. |
Which is better?
Footprint charts provide detailed order flow information by displaying volume at each price level, allowing traders to analyze market depth and identify precise buying and selling imbalances. Heikin Ashi charts smooth price action using averaged candlesticks, making trends clearer and reducing noise for easier visual trend identification. Traders focused on granular market data and order execution prefer footprint charts, while those prioritizing trend clarity and simplified signals tend to favor Heikin Ashi charts.
Connection
Footprint charts provide detailed order flow data by displaying volume traded at each price level, revealing trader activity behind price movements. Heikin Ashi charts smooth price action using modified candlesticks to filter noise and identify trends clearly. Combining footprint charts with Heikin Ashi enhances trading decisions by merging precise volume analysis with trend clarity, improving entry and exit timing in volatile markets.
Key Terms
Candlestick Patterns
Heikin Ashi charts smooth price data using modified candlesticks to highlight trend direction, reducing market noise and making patterns like doji and engulfing candles easier to identify. Footprint charts display detailed order flow data, showing bid-ask volume at each price level, providing granular insight into market sentiment and reversals that traditional candlestick patterns might miss. Explore the distinct advantages of these charting techniques to enhance your trading strategy and interpret market signals more effectively.
Volume Analysis
Heikin Ashi charts smooth price data to highlight trends and reduce market noise, making them ideal for identifying momentum and trend reversals. Footprint charts provide granular volume analysis by displaying bid and ask volumes at each price level, offering detailed insights into market participation and order flow. Explore these tools further to enhance your volume-based trading strategies.
Order Flow
Heikin Ashi charts smooth price data through modified candlesticks, helping traders identify trends by filtering market noise, while footprint charts provide detailed order flow information by displaying volume, bid-ask splits, and executed trades at specific price levels. Traders focusing on order flow prefer footprint charts for their granular insights into market activity and liquidity, enabling precise entry and exit decisions. Explore more to understand how these charts can enhance your trading strategy with order flow analysis.
Source and External Links
Heikin-Ashi chart - Heikin Ashi charts resemble candlestick charts but use averaged price data to smooth market noise, showing trends more clearly and allowing prediction of the next market move with about 72-75% accuracy, making them more reliable than raw market data.
What is the Heikin Ashi Candlestick and How Can I Use it? - IG - Heikin Ashi candlesticks calculate open, close, high, and low prices using averages of current and previous bars, with green candles indicating rising prices and red candles indicating falling prices, which helps traders analyze trends in price movement.
Understanding Heikin Ashi charts - TradingView - These charts differ from standard candlesticks by using averaged prices to filter out market noise and identify trends more clearly; Heikin Ashi candles open at midpoint of the previous candle and their calculations lag by one period.