Volume profile reading reveals the distribution of traded volume at various price levels, highlighting areas of high market activity and potential support or resistance. Liquidity zones identify price regions where large orders cluster, indicating significant buying or selling interest that can influence price movements. Explore deeper insights into how volume profile and liquidity zones can refine your trading strategy.
Why it is important
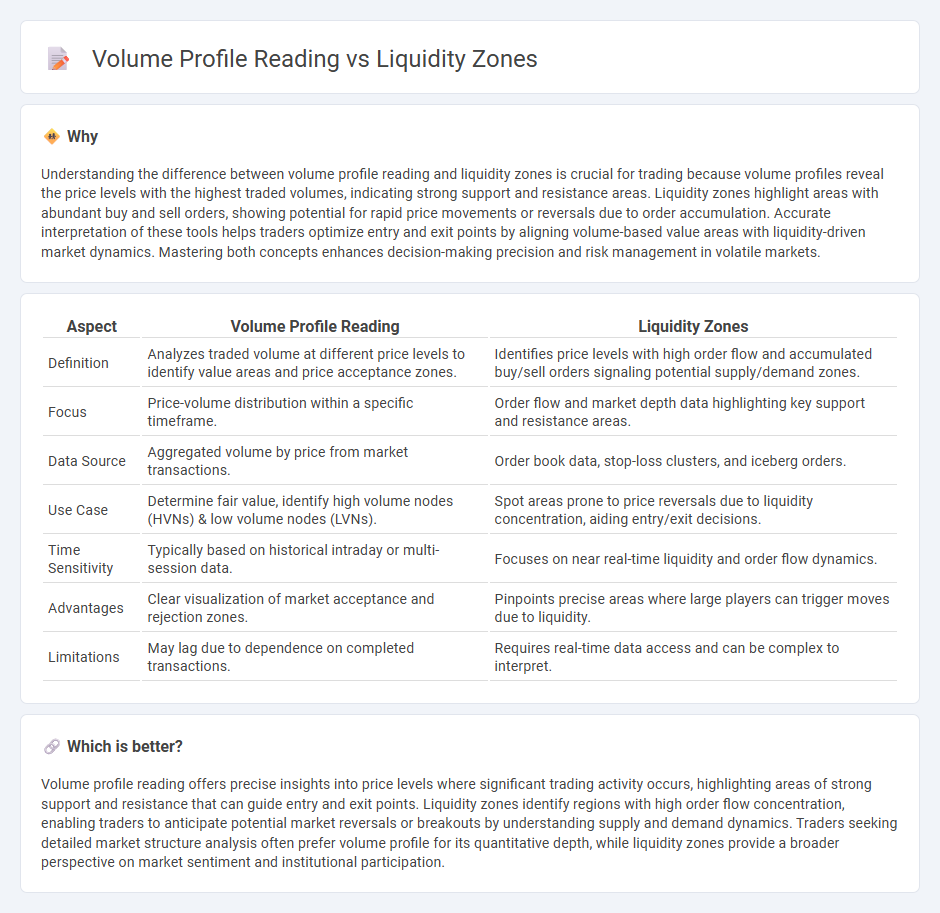
Understanding the difference between volume profile reading and liquidity zones is crucial for trading because volume profiles reveal the price levels with the highest traded volumes, indicating strong support and resistance areas. Liquidity zones highlight areas with abundant buy and sell orders, showing potential for rapid price movements or reversals due to order accumulation. Accurate interpretation of these tools helps traders optimize entry and exit points by aligning volume-based value areas with liquidity-driven market dynamics. Mastering both concepts enhances decision-making precision and risk management in volatile markets.
Comparison Table
| Aspect | Volume Profile Reading | Liquidity Zones |
|---|---|---|
| Definition | Analyzes traded volume at different price levels to identify value areas and price acceptance zones. | Identifies price levels with high order flow and accumulated buy/sell orders signaling potential supply/demand zones. |
| Focus | Price-volume distribution within a specific timeframe. | Order flow and market depth data highlighting key support and resistance areas. |
| Data Source | Aggregated volume by price from market transactions. | Order book data, stop-loss clusters, and iceberg orders. |
| Use Case | Determine fair value, identify high volume nodes (HVNs) & low volume nodes (LVNs). | Spot areas prone to price reversals due to liquidity concentration, aiding entry/exit decisions. |
| Time Sensitivity | Typically based on historical intraday or multi-session data. | Focuses on near real-time liquidity and order flow dynamics. |
| Advantages | Clear visualization of market acceptance and rejection zones. | Pinpoints precise areas where large players can trigger moves due to liquidity. |
| Limitations | May lag due to dependence on completed transactions. | Requires real-time data access and can be complex to interpret. |
Which is better?
Volume profile reading offers precise insights into price levels where significant trading activity occurs, highlighting areas of strong support and resistance that can guide entry and exit points. Liquidity zones identify regions with high order flow concentration, enabling traders to anticipate potential market reversals or breakouts by understanding supply and demand dynamics. Traders seeking detailed market structure analysis often prefer volume profile for its quantitative depth, while liquidity zones provide a broader perspective on market sentiment and institutional participation.
Connection
Volume profile reading identifies price levels with significant trading activity, highlighting liquidity zones where orders accumulate. These liquidity zones indicate areas of potential support or resistance, guiding traders on market entry and exit points. Understanding the interplay between volume profiles and liquidity zones enhances precision in predicting price movements.
Key Terms
Order Blocks
Liquidity zones highlight price levels where significant buying or selling interest concentrates, often marking areas of potential support or resistance. Volume profile reading maps trading activity across price levels, revealing areas with dense volume clusters that correspond to order blocks--zones where institutional orders accumulate, influencing market direction. Explore how understanding order blocks through volume profiles and liquidity zones can enhance your trading strategy further.
High Volume Nodes (HVN)
High Volume Nodes (HVN) in volume profile reading represent price levels with significant trading activity, indicating strong liquidity zones where market participants actively transact. These zones often act as support or resistance, highlighting areas of price consolidation and potential reversals. Explore deeper insights on how HVN influence market behavior and trading strategies by learning more about liquidity zones and volume profiles.
Support and Resistance
Liquidity zones represent price levels where buy and sell orders accumulate, causing frequent reversals or consolidations, while volume profile reading analyzes traded volume distribution across these price levels to identify significant support and resistance areas. Support and resistance identified through liquidity zones highlight potential market entry and exit points based on order flow, whereas volume profile emphasizes market acceptance and rejection levels by showing high and low volume nodes. Explore these techniques further to enhance your trading strategy with precise market context.
Source and External Links
SMC Trading Basics. Liquidity Zones & How to Identify Them - Liquidity zones are areas on price charts with significant concentration of trading volumes, characterized by huge volume spikes, strong price rejections with long wicks, and long consolidation periods, indicating presence of big players and providing safe, profitable trading opportunities.
Learn 7 Types of Liquidity Zones in Trading - TradingView - Liquidity zones are specific price areas attracting large order concentrations based on historically significant price levels, trend lines, technical indicators like moving averages, and confluence of multiple factors, often serving as key reference points for market liquidity.
How to Map Liquidity Zones and Order Blocks - LuxAlgo - Liquidity zones represent price areas with high buy/sell orders often near round numbers or support/resistance levels; mapping them involves identifying volume spikes, sharp reversals, and strong price rejections to enhance trading precision and risk management.