Volume profile reading maps the distribution of traded volume at specific price levels, revealing key support and resistance zones essential for precise market entry and exit points. Delta analysis focuses on the net difference between buying and selling volume, providing insights into market momentum and potential trend reversals. Explore in-depth strategies to combine volume profile and delta analysis for enhanced trading decisions.
Why it is important
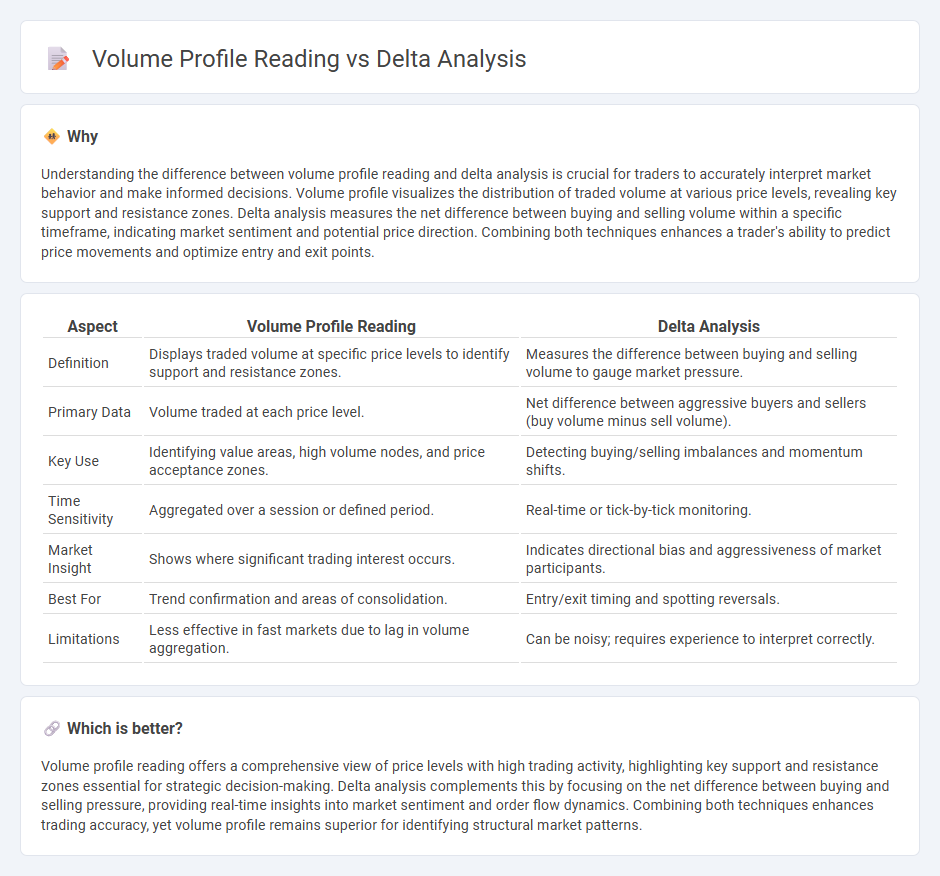
Understanding the difference between volume profile reading and delta analysis is crucial for traders to accurately interpret market behavior and make informed decisions. Volume profile visualizes the distribution of traded volume at various price levels, revealing key support and resistance zones. Delta analysis measures the net difference between buying and selling volume within a specific timeframe, indicating market sentiment and potential price direction. Combining both techniques enhances a trader's ability to predict price movements and optimize entry and exit points.
Comparison Table
| Aspect | Volume Profile Reading | Delta Analysis |
|---|---|---|
| Definition | Displays traded volume at specific price levels to identify support and resistance zones. | Measures the difference between buying and selling volume to gauge market pressure. |
| Primary Data | Volume traded at each price level. | Net difference between aggressive buyers and sellers (buy volume minus sell volume). |
| Key Use | Identifying value areas, high volume nodes, and price acceptance zones. | Detecting buying/selling imbalances and momentum shifts. |
| Time Sensitivity | Aggregated over a session or defined period. | Real-time or tick-by-tick monitoring. |
| Market Insight | Shows where significant trading interest occurs. | Indicates directional bias and aggressiveness of market participants. |
| Best For | Trend confirmation and areas of consolidation. | Entry/exit timing and spotting reversals. |
| Limitations | Less effective in fast markets due to lag in volume aggregation. | Can be noisy; requires experience to interpret correctly. |
Which is better?
Volume profile reading offers a comprehensive view of price levels with high trading activity, highlighting key support and resistance zones essential for strategic decision-making. Delta analysis complements this by focusing on the net difference between buying and selling pressure, providing real-time insights into market sentiment and order flow dynamics. Combining both techniques enhances trading accuracy, yet volume profile remains superior for identifying structural market patterns.
Connection
Volume profile reading maps the distribution of traded volume at specific price levels, revealing areas of support and resistance, while delta analysis measures the net difference between buying and selling pressure within those levels. Combining volume profile with delta analysis provides a nuanced view of market sentiment by highlighting imbalances between aggressive market participants. This integration enables traders to identify potential trend reversals and confirm breakout or breakdown signals with greater precision.
Key Terms
**Delta Analysis:**
Delta analysis measures the net difference between buying and selling volumes at each price level, offering insights into market sentiment and order flow strength. This method helps traders identify potential reversals or continuations by highlighting aggressive buyer or seller dominance within specific time frames. Explore deeper techniques and applications of delta analysis to refine your trading strategy.
Bid-Ask Imbalance
Delta analysis measures the net difference between executed buy and sell orders at the bid and ask prices, providing insight into market sentiment and order flow intensity. Volume profile reading displays the distribution of traded volume at various price levels, highlighting areas of high liquidity and potential support or resistance based on bid-ask imbalance. Discover how mastering bid-ask imbalance through both methods can enhance your trading strategies by exploring detailed techniques and real-time applications.
Cumulative Delta
Cumulative Delta analysis tracks the net difference between buying and selling volume, providing insights into market sentiment by aggregating order flow over time. Volume Profile reading maps traded volume at specific price levels, highlighting key support and resistance zones but lacks the directional flow detail offered by Cumulative Delta. Explore the advantages of integrating Cumulative Delta with Volume Profile for more precise trading decisions.
Source and External Links
What is delta in statistics? Measuring change in experiments - Statsig - Delta in statistics, symbolized by D, quantifies the difference or change between variables, playing a key role in experiments such as A/B testing where it measures treatment effects as absolute or percent differences, and the Delta Method uses Taylor series expansions to approximate distributions and variances for hypothesis testing and confidence intervals.
The Delta Principle of Data Analysis - The Data Story Guide - The Delta Principle in data analysis focuses on comparing results that have similar types of errors, emphasizing relative differences (deltas) rather than absolute values to better interpret survey and measurement data by comparing sub-groups, over time, or against benchmarks.
Delta Analysis - Ewon Online Help Center - Delta Analysis compares measurements between two objects or one object over two equal time intervals to identify differences (deltas) in data series, facilitating analysis of changes within operational contexts such as organizational units or defined time periods.