Order flow footprint charts provide a detailed visual representation of real-time buying and selling activity at specific price levels, highlighting market participants' aggressiveness and liquidity. Cumulative Delta aggregates the net difference between buying and selling volume over time, revealing market sentiment shifts and potential trend reversals. Explore these advanced trading tools to enhance your market analysis and improve decision-making precision.
Why it is important
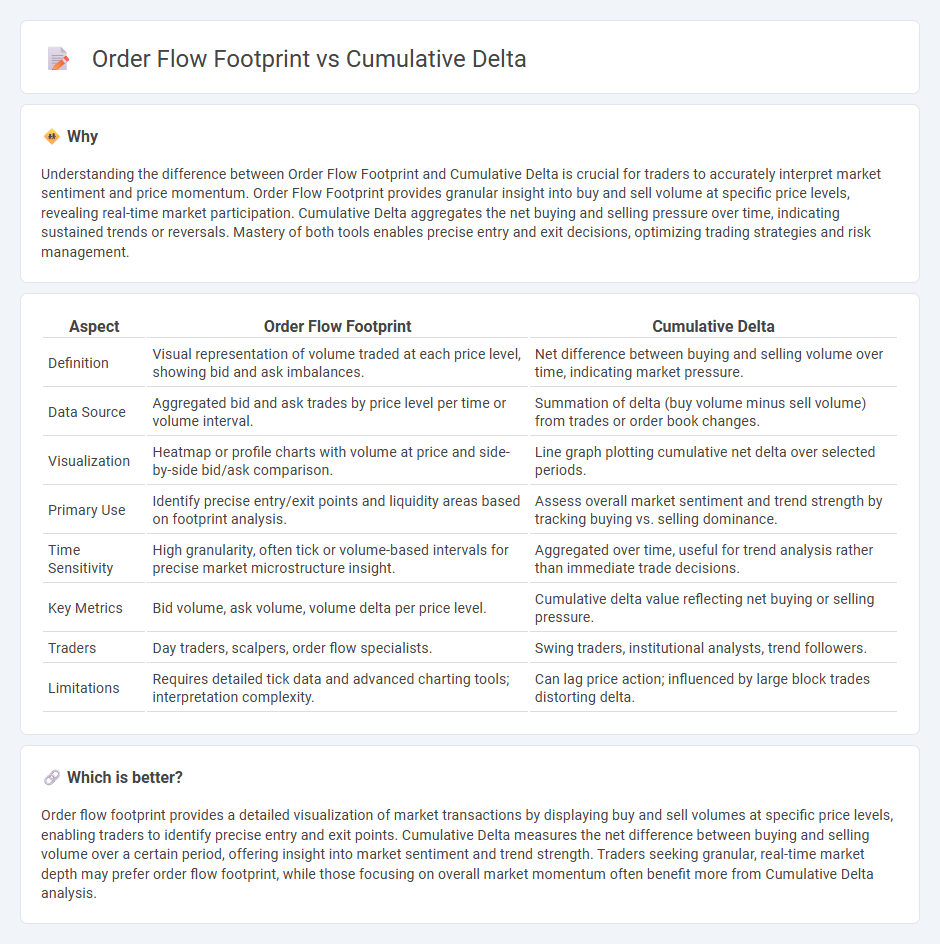
Understanding the difference between Order Flow Footprint and Cumulative Delta is crucial for traders to accurately interpret market sentiment and price momentum. Order Flow Footprint provides granular insight into buy and sell volume at specific price levels, revealing real-time market participation. Cumulative Delta aggregates the net buying and selling pressure over time, indicating sustained trends or reversals. Mastery of both tools enables precise entry and exit decisions, optimizing trading strategies and risk management.
Comparison Table
| Aspect | Order Flow Footprint | Cumulative Delta |
|---|---|---|
| Definition | Visual representation of volume traded at each price level, showing bid and ask imbalances. | Net difference between buying and selling volume over time, indicating market pressure. |
| Data Source | Aggregated bid and ask trades by price level per time or volume interval. | Summation of delta (buy volume minus sell volume) from trades or order book changes. |
| Visualization | Heatmap or profile charts with volume at price and side-by-side bid/ask comparison. | Line graph plotting cumulative net delta over selected periods. |
| Primary Use | Identify precise entry/exit points and liquidity areas based on footprint analysis. | Assess overall market sentiment and trend strength by tracking buying vs. selling dominance. |
| Time Sensitivity | High granularity, often tick or volume-based intervals for precise market microstructure insight. | Aggregated over time, useful for trend analysis rather than immediate trade decisions. |
| Key Metrics | Bid volume, ask volume, volume delta per price level. | Cumulative delta value reflecting net buying or selling pressure. |
| Traders | Day traders, scalpers, order flow specialists. | Swing traders, institutional analysts, trend followers. |
| Limitations | Requires detailed tick data and advanced charting tools; interpretation complexity. | Can lag price action; influenced by large block trades distorting delta. |
Which is better?
Order flow footprint provides a detailed visualization of market transactions by displaying buy and sell volumes at specific price levels, enabling traders to identify precise entry and exit points. Cumulative Delta measures the net difference between buying and selling volume over a certain period, offering insight into market sentiment and trend strength. Traders seeking granular, real-time market depth may prefer order flow footprint, while those focusing on overall market momentum often benefit more from Cumulative Delta analysis.
Connection
Order flow footprint displays detailed buying and selling activity at each price level, while Cumulative Delta measures the net difference between aggressive buy and sell orders over time. The connection lies in their mutual ability to reveal market sentiment and liquidity dynamics by analyzing executed trades, with footprint charts providing granular entry and exit points and Cumulative Delta highlighting overall market pressure trends. Traders use both tools together to enhance precision in identifying potential reversals and confirming trend strength.
Key Terms
Bid-Ask Volume
Cumulative Delta measures the net difference between buy and sell orders, providing insights into market sentiment by aggregating bid-ask volume over time, while order flow footprint charts visually represent precise bid and ask volume at specific price levels within a trading session. Bid-ask volume analysis highlights supply and demand imbalances, enabling traders to detect shifts in market pressure and liquidity before significant price movements occur. Explore more to understand how integrating cumulative delta with order flow footprint can enhance trading strategies.
Imbalance
Cumulative Delta tracks the net difference between buying and selling volume over time, highlighting overall market sentiment shifts, while order flow footprint charts provide granular details of trade executions at specific price levels, emphasizing real-time supply and demand dynamics. Imbalance metrics within order flow footprints reveal clusters of aggressive buying or selling, offering traders actionable insights into potential reversals or continuations. Explore advanced strategies and detailed analyses to leverage cumulative delta and order flow footprint imbalances for enhanced trading decisions.
Trade Aggression
Cumulative Delta measures the net difference between market buy and sell orders to indicate buying or selling pressure, while Order Flow Footprint provides a detailed view of trade aggressiveness by displaying executed volume at bid and ask prices. Understanding Trade Aggression through these tools helps traders identify market sentiment shifts and potential reversal points. Explore deeper insights into Trade Aggression analysis to enhance your trading strategy precision.
Source and External Links
Cumulative Volume Delta Explained - LuxAlgo - Cumulative Volume Delta (CVD) tracks the running net difference between buying and selling volume to reveal market sentiment and potential price reversals.
Lesson 8 - Practical Use Of Cumulative Delta Charts - Jigsaw Trading - Cumulative Delta is calculated as market buy orders minus market sell orders, highlighting whether aggressive buyers or sellers are dominating the market.
How Cumulative Volume Delta Can Transform Your Trading Strategy - Bookmap - CVD measures the net difference between buying and selling volume over time, helping traders detect shifts in market pressure and confirm trend strength beyond price action alone.