Order flow footprint charts provide detailed insights into market sentiment by displaying individual buy and sell orders at specific price levels, highlighting trader activity and liquidity. Cluster charts aggregate volume data at price clusters, enabling traders to identify strong support and resistance zones based on volume concentration. Explore these analytical tools further to enhance precision in your trading strategies.
Why it is important
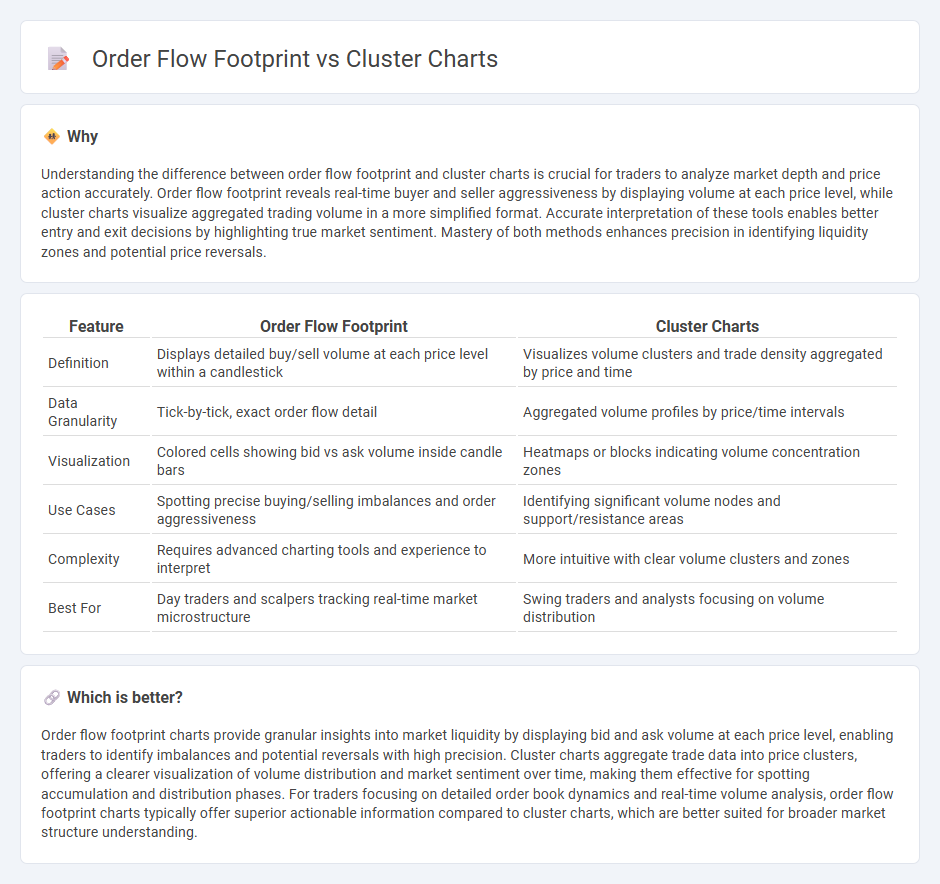
Understanding the difference between order flow footprint and cluster charts is crucial for traders to analyze market depth and price action accurately. Order flow footprint reveals real-time buyer and seller aggressiveness by displaying volume at each price level, while cluster charts visualize aggregated trading volume in a more simplified format. Accurate interpretation of these tools enables better entry and exit decisions by highlighting true market sentiment. Mastery of both methods enhances precision in identifying liquidity zones and potential price reversals.
Comparison Table
| Feature | Order Flow Footprint | Cluster Charts |
|---|---|---|
| Definition | Displays detailed buy/sell volume at each price level within a candlestick | Visualizes volume clusters and trade density aggregated by price and time |
| Data Granularity | Tick-by-tick, exact order flow detail | Aggregated volume profiles by price/time intervals |
| Visualization | Colored cells showing bid vs ask volume inside candle bars | Heatmaps or blocks indicating volume concentration zones |
| Use Cases | Spotting precise buying/selling imbalances and order aggressiveness | Identifying significant volume nodes and support/resistance areas |
| Complexity | Requires advanced charting tools and experience to interpret | More intuitive with clear volume clusters and zones |
| Best For | Day traders and scalpers tracking real-time market microstructure | Swing traders and analysts focusing on volume distribution |
Which is better?
Order flow footprint charts provide granular insights into market liquidity by displaying bid and ask volume at each price level, enabling traders to identify imbalances and potential reversals with high precision. Cluster charts aggregate trade data into price clusters, offering a clearer visualization of volume distribution and market sentiment over time, making them effective for spotting accumulation and distribution phases. For traders focusing on detailed order book dynamics and real-time volume analysis, order flow footprint charts typically offer superior actionable information compared to cluster charts, which are better suited for broader market structure understanding.
Connection
Order flow footprint and Cluster Charts both provide detailed insights into market transactions by visualizing volume and price data at specific price levels. Order flow footprint displays the bid and ask volume executed at each price, while Cluster Charts aggregate trades into clusters that reveal buying and selling pressure within each bar or time period. These tools complement each other by offering granular market depth analysis, helping traders identify supply and demand zones and potential reversals.
Key Terms
Volume Imbalances
Cluster charts visually represent trading volumes at specific price levels, highlighting buy and sell imbalances to identify potential market reversals. Order flow footprint charts provide detailed insights into volume imbalances by displaying real-time bid and ask volume, enabling traders to gauge market sentiment with precision. Explore how volume imbalances in cluster and footprint charts can enhance your trading strategy by diving deeper into their analysis techniques.
Bid-Ask Analysis
Cluster charts provide a granular visualization of price action by displaying volume distribution at each price level, helping traders identify support and resistance zones with precision. Order flow footprint charts enhance bid-ask analysis by showing executed trades at bid and ask prices, revealing market sentiment and liquidity dynamics in real time. Explore detailed comparisons and practical applications to optimize your trading strategy.
Source and External Links
Cluster chart - TraderEvolution Guide - Cluster charts help traders visually identify large volumes, speed of trades, and relative value at different price levels, useful for all trading timeframes and styles, with customizable aggregation and data types like volume, buy/sell volume, and delta.
Cluster chart | Quantower - Also known as Footprint charts, cluster charts provide detailed views inside price action by showing volumes, buy/sell trades, and zones of high interest at each price level, customizable with multiple visualization types and data overlays.
Clustered Column Chart - Clustered column charts are vertical bar charts grouping bars by categories and subcategories, enabling comparison of multiple metrics across groups, best suited for visualizing detailed data sets beyond basic bar charts.