Volume profile reading maps the distribution of traded volume at various price levels to identify key support and resistance zones, revealing market sentiment and price acceptance areas. Cluster analysis examines detailed order flow and trade executions within these price levels, detecting buying or selling imbalances to predict short-term price movements. Explore these methods further to enhance your trading strategy and gain deeper market insights.
Why it is important
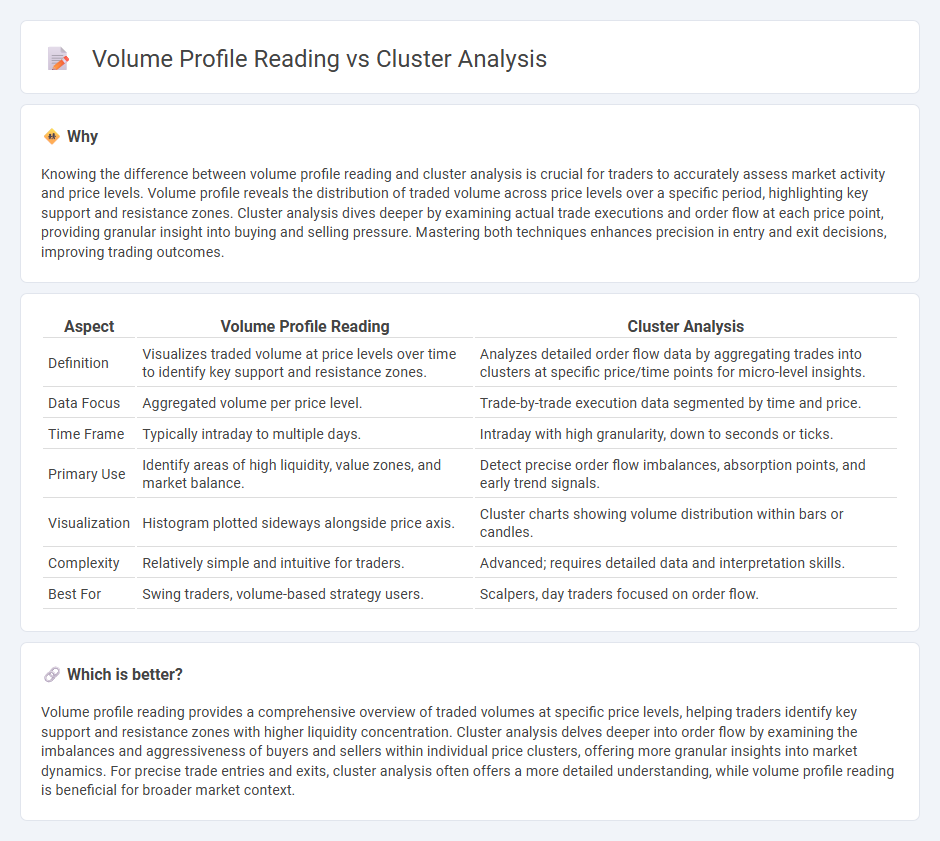
Knowing the difference between volume profile reading and cluster analysis is crucial for traders to accurately assess market activity and price levels. Volume profile reveals the distribution of traded volume across price levels over a specific period, highlighting key support and resistance zones. Cluster analysis dives deeper by examining actual trade executions and order flow at each price point, providing granular insight into buying and selling pressure. Mastering both techniques enhances precision in entry and exit decisions, improving trading outcomes.
Comparison Table
| Aspect | Volume Profile Reading | Cluster Analysis |
|---|---|---|
| Definition | Visualizes traded volume at price levels over time to identify key support and resistance zones. | Analyzes detailed order flow data by aggregating trades into clusters at specific price/time points for micro-level insights. |
| Data Focus | Aggregated volume per price level. | Trade-by-trade execution data segmented by time and price. |
| Time Frame | Typically intraday to multiple days. | Intraday with high granularity, down to seconds or ticks. |
| Primary Use | Identify areas of high liquidity, value zones, and market balance. | Detect precise order flow imbalances, absorption points, and early trend signals. |
| Visualization | Histogram plotted sideways alongside price axis. | Cluster charts showing volume distribution within bars or candles. |
| Complexity | Relatively simple and intuitive for traders. | Advanced; requires detailed data and interpretation skills. |
| Best For | Swing traders, volume-based strategy users. | Scalpers, day traders focused on order flow. |
Which is better?
Volume profile reading provides a comprehensive overview of traded volumes at specific price levels, helping traders identify key support and resistance zones with higher liquidity concentration. Cluster analysis delves deeper into order flow by examining the imbalances and aggressiveness of buyers and sellers within individual price clusters, offering more granular insights into market dynamics. For precise trade entries and exits, cluster analysis often offers a more detailed understanding, while volume profile reading is beneficial for broader market context.
Connection
Volume profile reading identifies price levels with high trading activity by analyzing cumulative volume at each price point, while cluster analysis breaks down transactions into specific time and price intervals to reveal detailed order flow and market sentiment. Combining volume profile with cluster analysis enhances traders' ability to pinpoint support and resistance zones, detect liquidity pockets, and anticipate potential reversals based on concentrated buying or selling pressure. This integrated approach improves precision in entry and exit decisions by aligning volume distribution patterns with real-time order flow dynamics.
Key Terms
**Cluster Analysis:**
Cluster analysis examines order flow by grouping trades based on price, volume, and time, providing detailed insights into market activity and trader behavior. This method reveals hidden liquidity and supply-demand dynamics that volume profile reading, which summarizes traded volume across price levels, might overlook. Explore cluster analysis further to enhance precision in market timing and strategy development.
Footprint Chart
Footprint Charts provide detailed trade-by-trade information, revealing the volume traded at each price level within a bar, enabling precise identification of buying and selling pressure. Cluster analysis aggregates this raw data into meaningful groups, highlighting volume imbalances and market sentiment with clearer visual patterns. Explore advanced Footprint Chart techniques to enhance your volume profile reading and trading strategies.
Order Flow
Cluster analysis dissects order flow by grouping trades based on price, time, and volume, revealing detailed trading activity and market sentiment. Volume profile reading visualizes the distribution of traded volume at various price levels, highlighting key support and resistance zones derived from accumulated order flow data. Explore further to understand how these techniques enhance trading decisions through precise order flow insights.
Source and External Links
What is cluster analysis in marketing? - Cluster analysis is an unsupervised classification technique that groups data into meaningful clusters with clear separation, consistency, and real-world usefulness, providing actionable insights, especially for targeting marketing strategies.
Conduct and Interpret a Cluster Analysis - Cluster analysis identifies natural groupings within data using methods like K-means, hierarchical, and two-step clustering, aiding exploration of hidden patterns for informed decision-making.
Cluster Analysis - Methods, Applications, and Algorithms - Cluster analysis uses various algorithms such as partition-based (e.g., K-means), hierarchical, and density-based to iteratively group data points into clusters, with K-means being a popular method to partition data into specified numbers of clusters.