Quantitative signals rely on mathematical algorithms and statistical models to identify trading opportunities based on historical market data, while chart pattern recognition focuses on visual identification of price formations such as head and shoulders or triangles. Quantitative methods provide objective and data-driven insights, reducing emotional bias, whereas chart patterns offer intuitive and time-tested strategies rooted in technical analysis. Explore more to understand how combining both approaches can enhance your trading decisions.
Why it is important
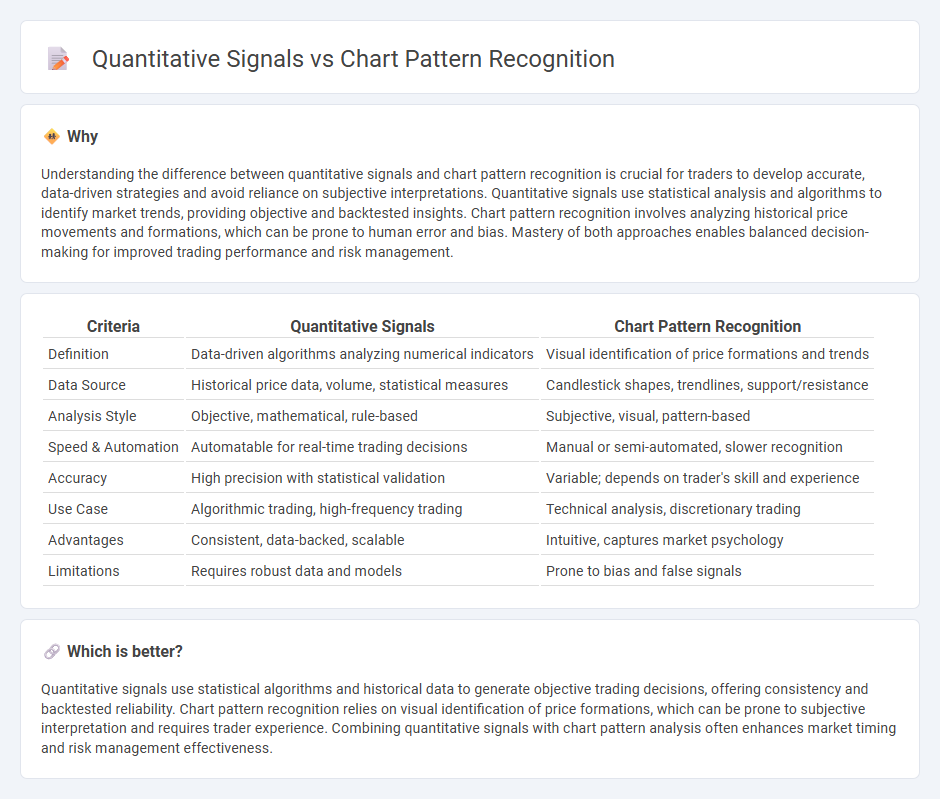
Understanding the difference between quantitative signals and chart pattern recognition is crucial for traders to develop accurate, data-driven strategies and avoid reliance on subjective interpretations. Quantitative signals use statistical analysis and algorithms to identify market trends, providing objective and backtested insights. Chart pattern recognition involves analyzing historical price movements and formations, which can be prone to human error and bias. Mastery of both approaches enables balanced decision-making for improved trading performance and risk management.
Comparison Table
| Criteria | Quantitative Signals | Chart Pattern Recognition |
|---|---|---|
| Definition | Data-driven algorithms analyzing numerical indicators | Visual identification of price formations and trends |
| Data Source | Historical price data, volume, statistical measures | Candlestick shapes, trendlines, support/resistance |
| Analysis Style | Objective, mathematical, rule-based | Subjective, visual, pattern-based |
| Speed & Automation | Automatable for real-time trading decisions | Manual or semi-automated, slower recognition |
| Accuracy | High precision with statistical validation | Variable; depends on trader's skill and experience |
| Use Case | Algorithmic trading, high-frequency trading | Technical analysis, discretionary trading |
| Advantages | Consistent, data-backed, scalable | Intuitive, captures market psychology |
| Limitations | Requires robust data and models | Prone to bias and false signals |
Which is better?
Quantitative signals use statistical algorithms and historical data to generate objective trading decisions, offering consistency and backtested reliability. Chart pattern recognition relies on visual identification of price formations, which can be prone to subjective interpretation and requires trader experience. Combining quantitative signals with chart pattern analysis often enhances market timing and risk management effectiveness.
Connection
Quantitative signals analyze historical price data using mathematical models to identify trading opportunities, while chart pattern recognition visually detects recurring price formations indicating market sentiment. The integration of quantitative signals with chart pattern recognition enhances decision-making by combining numerical precision with visual trend analysis. This synergy optimizes predictive accuracy, helping traders anticipate price movements more effectively.
Key Terms
Chart Pattern Recognition:
Chart pattern recognition identifies specific formations within price charts, such as head and shoulders, double tops, and triangles, to predict potential market movements based on historical price behaviors. It relies on the visual analysis of these patterns to gauge market sentiment and trend reversals or continuations without extensive numerical computation. Explore more to understand how chart pattern recognition enhances trading strategies and complements quantitative signals.
Head and Shoulders
Head and Shoulders is a classic chart pattern used in technical analysis to predict trend reversals by identifying three peaks with the middle peak being the highest, signaling potential price decline. Quantitative signals use mathematical models and algorithms to analyze price data, volume, and momentum, providing objective trade triggers that may confirm or reject the Head and Shoulders pattern's reliability. Explore how integrating Head and Shoulders with quantitative signals can enhance trading accuracy and decision-making.
Double Top/Bottom
Chart pattern recognition identifies Double Top and Double Bottom formations based on price action and volume trends, signaling potential trend reversals in technical analysis. Quantitative signals use algorithmic models and statistical metrics, such as moving averages and relative strength index (RSI), to validate or complement these patterns objectively. Explore detailed methodologies to enhance trading strategies through combined pattern analysis and quantitative indicators.
Source and External Links
ChartPatterns.ai - AI-Powered Chart Pattern Recognition - An AI-based tool that detects 16 essential chart patterns instantly on any trading charts including Stocks, Forex, and Crypto by analyzing images or videos.
Algorithmic Identification and Classification of Chart Patterns - A guide on objectively identifying, defining, and classifying chart patterns algorithmically using tools like the Zigzag indicator to avoid bias in trading analysis.
Chart Patterns in Technical Analysis: A Comprehensive Guide - Explains that chart pattern recognition is a skill developed over time and can be aided by visualization techniques and automated recognition software, applying across various chart types and timeframes.