Footprint charts provide a granular view of market activity by displaying volume traded at each price level, revealing the actual buy and sell orders behind price movements. Candlestick charts summarize price action within fixed intervals, showing open, high, low, and close prices but lack detailed volume insights. Explore the advantages and applications of footprint charts compared to candlestick charts to enhance your trading strategy.
Why it is important
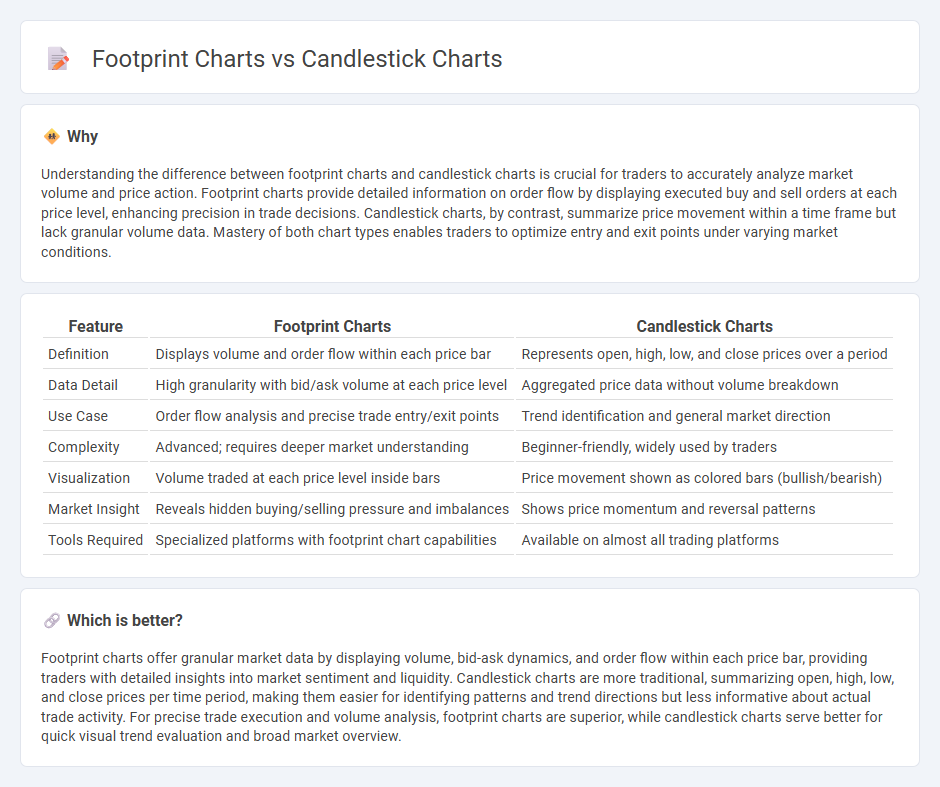
Understanding the difference between footprint charts and candlestick charts is crucial for traders to accurately analyze market volume and price action. Footprint charts provide detailed information on order flow by displaying executed buy and sell orders at each price level, enhancing precision in trade decisions. Candlestick charts, by contrast, summarize price movement within a time frame but lack granular volume data. Mastery of both chart types enables traders to optimize entry and exit points under varying market conditions.
Comparison Table
| Feature | Footprint Charts | Candlestick Charts |
|---|---|---|
| Definition | Displays volume and order flow within each price bar | Represents open, high, low, and close prices over a period |
| Data Detail | High granularity with bid/ask volume at each price level | Aggregated price data without volume breakdown |
| Use Case | Order flow analysis and precise trade entry/exit points | Trend identification and general market direction |
| Complexity | Advanced; requires deeper market understanding | Beginner-friendly, widely used by traders |
| Visualization | Volume traded at each price level inside bars | Price movement shown as colored bars (bullish/bearish) |
| Market Insight | Reveals hidden buying/selling pressure and imbalances | Shows price momentum and reversal patterns |
| Tools Required | Specialized platforms with footprint chart capabilities | Available on almost all trading platforms |
Which is better?
Footprint charts offer granular market data by displaying volume, bid-ask dynamics, and order flow within each price bar, providing traders with detailed insights into market sentiment and liquidity. Candlestick charts are more traditional, summarizing open, high, low, and close prices per time period, making them easier for identifying patterns and trend directions but less informative about actual trade activity. For precise trade execution and volume analysis, footprint charts are superior, while candlestick charts serve better for quick visual trend evaluation and broad market overview.
Connection
Footprint charts and candlestick charts are connected by their role in visualizing market data to enhance trading decisions. Candlestick charts display price action through open, high, low, and close values for specified time intervals, while footprint charts provide granular insights into order flow by showing volume traded at each price level within those intervals. Together, these charts allow traders to analyze both price trends and underlying market activity, improving accuracy in identifying supply and demand dynamics.
Key Terms
Price Action
Candlestick charts display open, high, low, and close prices for specific time frames, providing a clear visual of market trends and reversals through color-coded bars. Footprint charts go deeper, revealing detailed order flow by showing the volume traded at each price level and the balance between buyers and sellers within each candlestick. Explore more about how these tools enhance price action analysis and trading precision.
Volume
Candlestick charts display price movements using open, high, low, and close data within specific timeframes, providing an overview of market sentiment but limited volume detail. Footprint charts enhance volume analysis by illustrating the exact traded volume at each price level, enabling traders to identify buying and selling pressure with precision. Explore in-depth comparisons to leverage volume insights for improved trading strategies.
Order Flow
Candlestick charts display price movements through open, high, low, and close data, offering a clear visual of market trends but limited insight into trade execution details. Footprint charts provide granular order flow information by showing buy and sell volume at each price level, enabling traders to analyze market depth and supply-demand imbalances. Discover how integrating footprint charts enhances order flow analysis for more precise trading decisions.
Source and External Links
40 Powerful Candlestick Patterns: Trading Guide for Beginners - Candlestick charts use patterns like the Morning Star and Morning Star Doji to signal trend reversals, where candles represent open, high, low, and close prices giving traders insights into market sentiment with success rates around 65-68% for some patterns.
The BEST Candlestick Pattern Guide You'll EVER FIND - Candlestick charts show four price points (open, high, low, close) per period, offering more detailed information than line charts and helping traders understand market behavior and make informed decisions.
16 Candlestick Patterns Every Trader Should Know - IG - Candlestick charts display price movements and include patterns like the Piercing Line and Morning Star, which indicate potential bullish reversals after downtrends by showing changes in buying and selling pressure.