Data visualization dashboards revolutionize accounting by providing real-time insights, interactive charts, and automated data aggregation, significantly reducing human error compared to traditional manual ledgers. Manual ledgers demand meticulous entry and are prone to delays and inaccuracies, hindering timely decision-making. Explore how integrating data visualization dashboards can enhance financial accuracy and operational efficiency in your accounting processes.
Why it is important
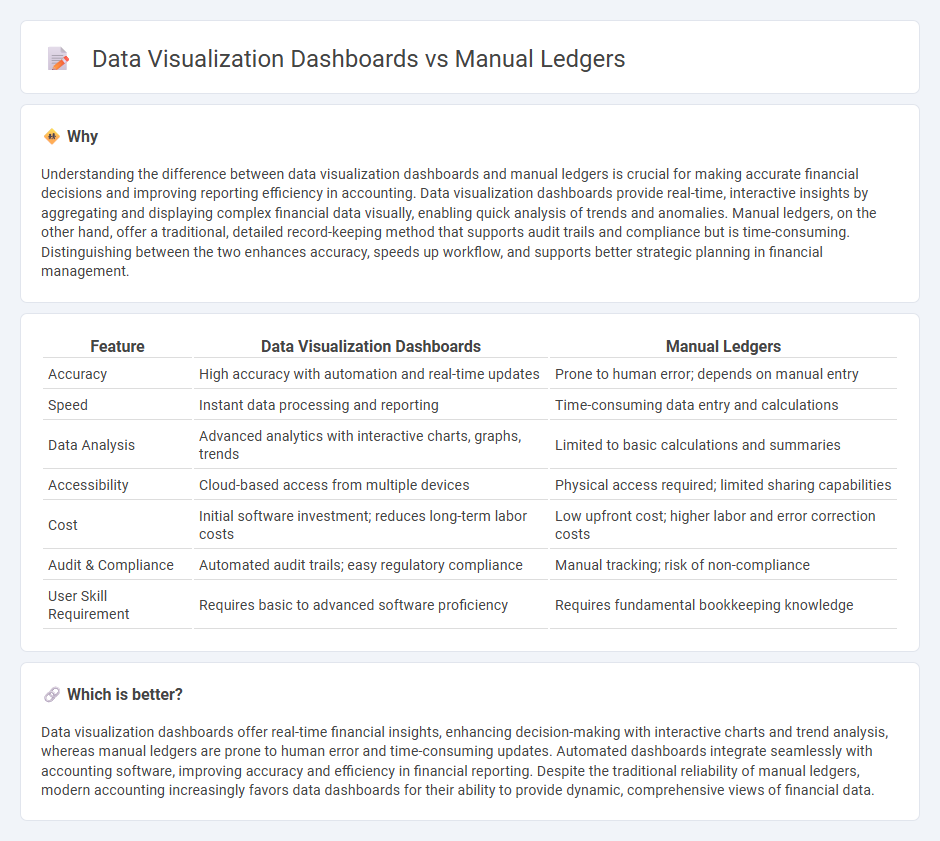
Understanding the difference between data visualization dashboards and manual ledgers is crucial for making accurate financial decisions and improving reporting efficiency in accounting. Data visualization dashboards provide real-time, interactive insights by aggregating and displaying complex financial data visually, enabling quick analysis of trends and anomalies. Manual ledgers, on the other hand, offer a traditional, detailed record-keeping method that supports audit trails and compliance but is time-consuming. Distinguishing between the two enhances accuracy, speeds up workflow, and supports better strategic planning in financial management.
Comparison Table
| Feature | Data Visualization Dashboards | Manual Ledgers |
|---|---|---|
| Accuracy | High accuracy with automation and real-time updates | Prone to human error; depends on manual entry |
| Speed | Instant data processing and reporting | Time-consuming data entry and calculations |
| Data Analysis | Advanced analytics with interactive charts, graphs, trends | Limited to basic calculations and summaries |
| Accessibility | Cloud-based access from multiple devices | Physical access required; limited sharing capabilities |
| Cost | Initial software investment; reduces long-term labor costs | Low upfront cost; higher labor and error correction costs |
| Audit & Compliance | Automated audit trails; easy regulatory compliance | Manual tracking; risk of non-compliance |
| User Skill Requirement | Requires basic to advanced software proficiency | Requires fundamental bookkeeping knowledge |
Which is better?
Data visualization dashboards offer real-time financial insights, enhancing decision-making with interactive charts and trend analysis, whereas manual ledgers are prone to human error and time-consuming updates. Automated dashboards integrate seamlessly with accounting software, improving accuracy and efficiency in financial reporting. Despite the traditional reliability of manual ledgers, modern accounting increasingly favors data dashboards for their ability to provide dynamic, comprehensive views of financial data.
Connection
Data visualization dashboards transform manual ledger entries into interactive graphical formats, enhancing real-time financial analysis and decision-making efficiency. Manual ledgers serve as the foundational source of raw financial data that dashboards extract, aggregate, and present with dynamic charts and KPIs. Integrating both tools improves accuracy in tracking transactions, identifying trends, and streamlining accounting workflows.
Key Terms
Double-entry bookkeeping
Double-entry bookkeeping ensures each financial transaction impacts two ledger accounts, maintaining balanced records in manual ledgers and dashboards alike. Manual ledgers require meticulous entry and reconciliation, while data visualization dashboards automate data integration, offering real-time insights with graphical summaries and error detection. Explore how modern dashboard tools enhance double-entry bookkeeping accuracy and efficiency for deeper financial understanding.
Chart of accounts
Manual ledgers record the Chart of Accounts using handwritten or typed entries, which can be time-consuming and prone to errors. Data visualization dashboards automate this process, offering dynamic, real-time insights that enhance clarity and decision-making. Explore how leveraging dashboards can transform your accounting accuracy and efficiency.
Real-time analytics
Manual ledgers rely on static, historical data entries, limiting the ability to perform real-time analytics and make swift business decisions. Data visualization dashboards integrate live data streams, enabling dynamic, real-time insights and trends analysis that empower proactive management. Explore how real-time analytics through dashboards can transform your operational efficiency and decision-making processes.
Source and External Links
manual accounting system | Wex - Law.Cornell.Edu - A manual accounting system records business transactions by hand in ledger books with columns for date, type of account, debit, credit, and notes, commonly used by small businesses to reduce costs and manage low transaction volumes
Manual accounting system | EBSCO Research Starters - Manual accounting uses paper ledgers and journals, with the general ledger as the main record, where bookkeepers record all financial transactions by hand without computer software
How to Create a Manual General Ledger with Excel? - SaasAnt - A manual general ledger can be created and maintained in Excel with columns for date, description, debit, and credit, allowing businesses to keep accurate, hand-recorded financial records easily