Data visualization dashboards provide real-time, interactive insights into financial performance, enabling quicker decision-making through dynamic charts and graphs. Budgeting templates offer structured frameworks for planning and controlling expenses, ensuring accuracy and consistency in financial forecasts. Explore the benefits of integrating both tools to enhance your accounting processes.
Why it is important
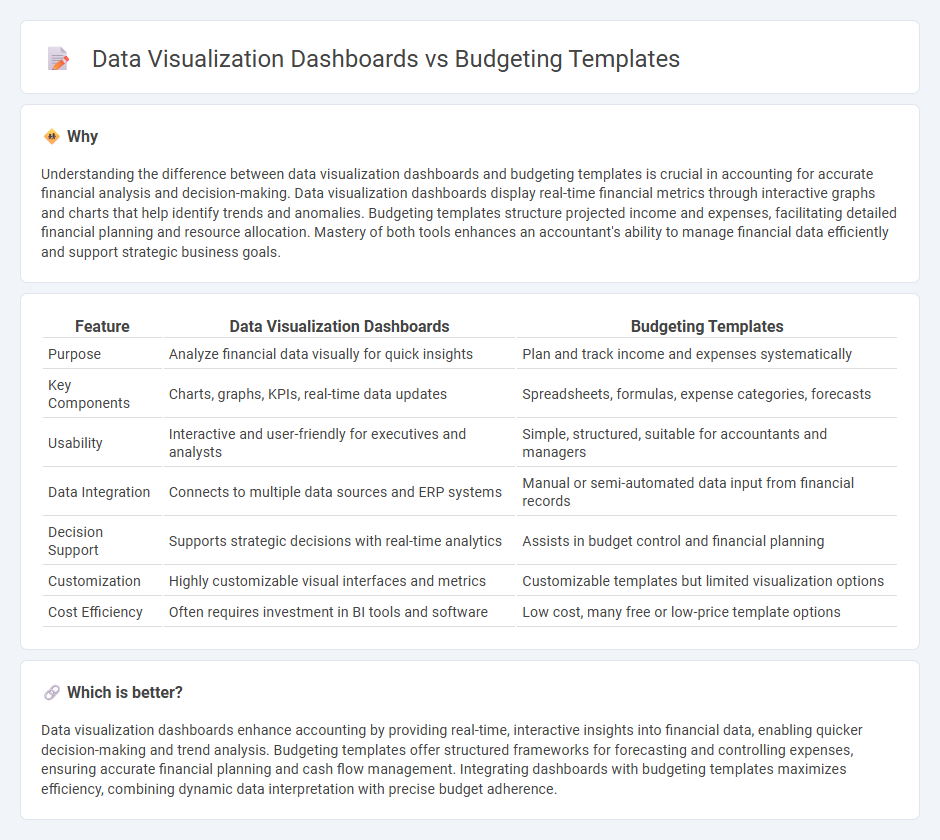
Understanding the difference between data visualization dashboards and budgeting templates is crucial in accounting for accurate financial analysis and decision-making. Data visualization dashboards display real-time financial metrics through interactive graphs and charts that help identify trends and anomalies. Budgeting templates structure projected income and expenses, facilitating detailed financial planning and resource allocation. Mastery of both tools enhances an accountant's ability to manage financial data efficiently and support strategic business goals.
Comparison Table
| Feature | Data Visualization Dashboards | Budgeting Templates |
|---|---|---|
| Purpose | Analyze financial data visually for quick insights | Plan and track income and expenses systematically |
| Key Components | Charts, graphs, KPIs, real-time data updates | Spreadsheets, formulas, expense categories, forecasts |
| Usability | Interactive and user-friendly for executives and analysts | Simple, structured, suitable for accountants and managers |
| Data Integration | Connects to multiple data sources and ERP systems | Manual or semi-automated data input from financial records |
| Decision Support | Supports strategic decisions with real-time analytics | Assists in budget control and financial planning |
| Customization | Highly customizable visual interfaces and metrics | Customizable templates but limited visualization options |
| Cost Efficiency | Often requires investment in BI tools and software | Low cost, many free or low-price template options |
Which is better?
Data visualization dashboards enhance accounting by providing real-time, interactive insights into financial data, enabling quicker decision-making and trend analysis. Budgeting templates offer structured frameworks for forecasting and controlling expenses, ensuring accurate financial planning and cash flow management. Integrating dashboards with budgeting templates maximizes efficiency, combining dynamic data interpretation with precise budget adherence.
Connection
Data visualization dashboards enhance accounting practices by transforming complex financial data into interactive visual insights, facilitating real-time monitoring of budget performance against set financial objectives. Budgeting templates provide structured frameworks for forecasting revenues and expenses, which feed accurate data into dashboards for comprehensive analysis. This integration streamlines decision-making processes, enabling accountants to identify trends, allocate resources efficiently, and ensure fiscal responsibility.
Key Terms
Variance Analysis
Budgeting templates provide structured formats for tracking financial plans and actual outcomes, facilitating precise variance analysis by highlighting deviations in revenue and expenses. Data visualization dashboards enable dynamic representation of these variances through graphs and charts, enhancing interpretation and quicker decision-making. Explore how integrating budgeting templates with visualization tools can optimize your variance analysis process.
Key Performance Indicators (KPIs)
Budgeting templates streamline financial planning by organizing expenses and revenues into structured formats, enabling precise tracking of budget adherence and cost control. Data visualization dashboards enhance performance analysis by graphically representing Key Performance Indicators (KPIs) such as profit margins, cash flow, and expense ratios, facilitating quick insights and decision-making. Explore how integrating budgeting templates with dynamic dashboards can optimize financial management and KPI monitoring in your organization.
Forecasting
Budgeting templates provide structured frameworks for inputting financial data and assumptions, enabling detailed forecasting through predefined categories and formulas. Data visualization dashboards enhance forecasting by transforming complex data sets into interactive charts and graphs, offering real-time insights and trend analysis. Explore how integrating both tools can improve accuracy and decision-making in financial forecasting.
Source and External Links
Understanding budget templates - Offers a variety of budget templates like monthly, zero-based, envelope, debt payoff, savings goal, and investment portfolio, customizable to suit personal financial goals.
Free Budget Spreadsheets and Tools - Provides free downloadable budget spreadsheet templates for different needs including annual, monthly, holiday, and business budgets, with options for Google Sheets and Microsoft Excel users.
Free budget templates - Features a wide range of customizable budget templates for household, personal, business, and special occasions, designed to make budgeting appealing and easy to manage.