Tape reading analyzes real-time transaction data to identify market sentiment and price movements by observing order flow and trade prints. Volume profile maps the distribution of traded volume at various price levels to highlight key support and resistance zones, revealing market structure. Explore the strengths and applications of tape reading versus volume profile to enhance your trading strategy.
Why it is important
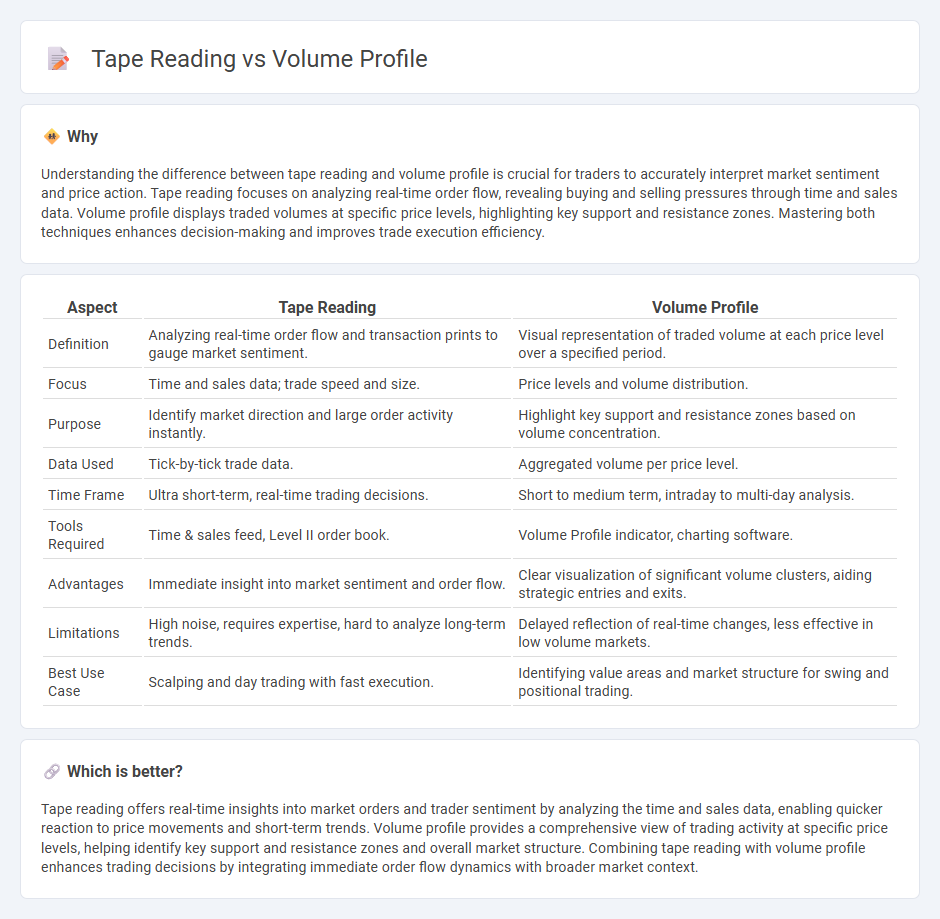
Understanding the difference between tape reading and volume profile is crucial for traders to accurately interpret market sentiment and price action. Tape reading focuses on analyzing real-time order flow, revealing buying and selling pressures through time and sales data. Volume profile displays traded volumes at specific price levels, highlighting key support and resistance zones. Mastering both techniques enhances decision-making and improves trade execution efficiency.
Comparison Table
| Aspect | Tape Reading | Volume Profile |
|---|---|---|
| Definition | Analyzing real-time order flow and transaction prints to gauge market sentiment. | Visual representation of traded volume at each price level over a specified period. |
| Focus | Time and sales data; trade speed and size. | Price levels and volume distribution. |
| Purpose | Identify market direction and large order activity instantly. | Highlight key support and resistance zones based on volume concentration. |
| Data Used | Tick-by-tick trade data. | Aggregated volume per price level. |
| Time Frame | Ultra short-term, real-time trading decisions. | Short to medium term, intraday to multi-day analysis. |
| Tools Required | Time & sales feed, Level II order book. | Volume Profile indicator, charting software. |
| Advantages | Immediate insight into market sentiment and order flow. | Clear visualization of significant volume clusters, aiding strategic entries and exits. |
| Limitations | High noise, requires expertise, hard to analyze long-term trends. | Delayed reflection of real-time changes, less effective in low volume markets. |
| Best Use Case | Scalping and day trading with fast execution. | Identifying value areas and market structure for swing and positional trading. |
Which is better?
Tape reading offers real-time insights into market orders and trader sentiment by analyzing the time and sales data, enabling quicker reaction to price movements and short-term trends. Volume profile provides a comprehensive view of trading activity at specific price levels, helping identify key support and resistance zones and overall market structure. Combining tape reading with volume profile enhances trading decisions by integrating immediate order flow dynamics with broader market context.
Connection
Tape reading analyzes real-time transaction data to gauge market sentiment and order flow, while volume profile visually represents the distribution of traded volume at specific price levels over a period. Both tools interconnect by providing traders with insights into liquidity zones, support and resistance levels, and potential price movements. Combining tape reading with volume profile enhances decision-making through a comprehensive view of market activity and volume concentration.
Key Terms
Order Flow
Volume profile analyzes the distribution of traded volumes at price levels to identify key support and resistance zones, while tape reading focuses on interpreting live order flow and time-and-sales data to gauge market sentiment and momentum. Both techniques provide traders with insights into institutional activity and liquidity, but volume profile offers a broader market context, whereas tape reading delivers real-time microstructure details. Explore more about how mastering order flow can enhance your trading edge.
Liquidity
Volume profile offers a granular visualization of trading activity at specific price levels, highlighting zones of high liquidity and potential support or resistance. Tape reading, on the other hand, provides real-time insights into order flow and market sentiment by analyzing the size, speed, and type of trades executed, helping traders identify liquidity shifts instantly. Explore the nuances of liquidity interpretation through volume profile and tape reading to enhance your trading edge.
Price Levels
Volume profile maps trading activity by price levels, showing where most volume has accumulated to identify support and resistance zones. Tape reading analyzes real-time order flow and trade prints to gauge market sentiment and momentum at specific price points. Explore how combining volume profile with tape reading enhances price level analysis and trading precision.
Source and External Links
Advanced Day Trading Strategies Using Volume Profile - TradingSim - Volume Profile is a volume-by-price indicator showing total trading activity at each price level over time, plotting a histogram on price charts to help traders identify significant price levels and improve trading performance.
Volume profile indicators: basic concepts - TradingView - Volume Profile is an advanced charting indicator that displays trading volume at specific price levels over a chosen time period, dividing volume into up or down trades and available in several types like fixed range or session profiles.
Understanding Volume Profile: A Powerful Tool for Traders - Volume Profile plots trading volume against price instead of time, allowing traders to identify key price levels with high liquidity which often act as support and resistance zones on the chart.