On-chain analytics provides real-time insights by examining blockchain transaction data, network activity, and wallet behavior, offering traders a direct view of market sentiment and asset flows. Chart pattern analysis relies on historical price movements and technical indicators to predict future trends based on recurring formations like head and shoulders or triangles. Explore the strengths and applications of each approach to enhance your trading strategy.
Why it is important
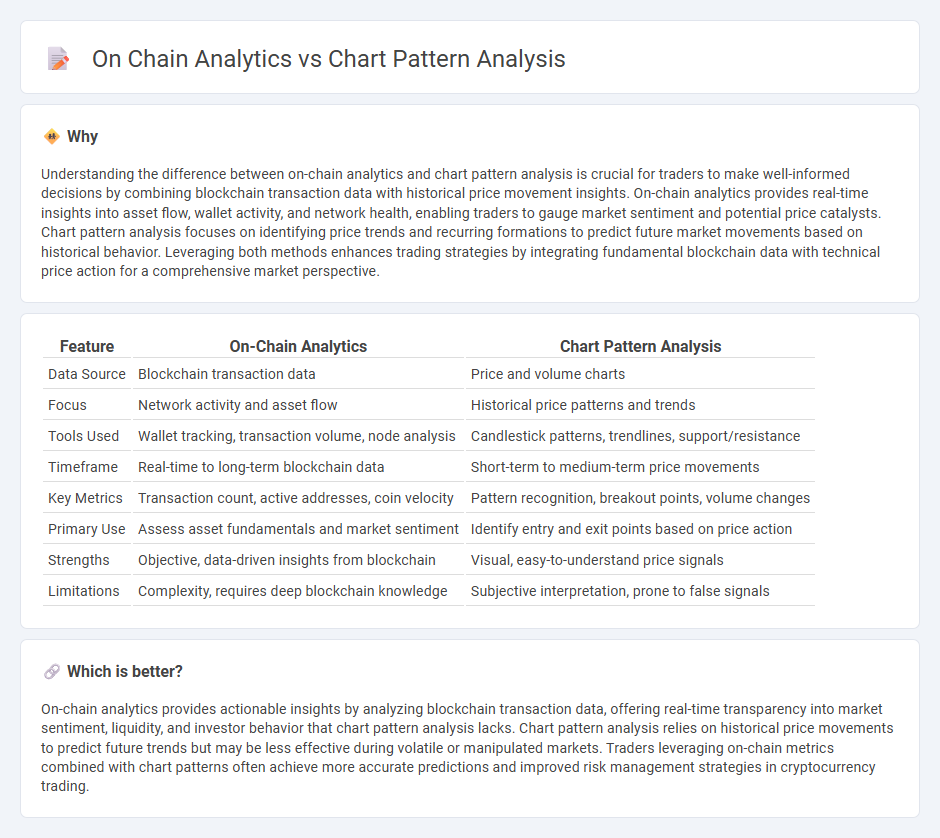
Understanding the difference between on-chain analytics and chart pattern analysis is crucial for traders to make well-informed decisions by combining blockchain transaction data with historical price movement insights. On-chain analytics provides real-time insights into asset flow, wallet activity, and network health, enabling traders to gauge market sentiment and potential price catalysts. Chart pattern analysis focuses on identifying price trends and recurring formations to predict future market movements based on historical behavior. Leveraging both methods enhances trading strategies by integrating fundamental blockchain data with technical price action for a comprehensive market perspective.
Comparison Table
| Feature | On-Chain Analytics | Chart Pattern Analysis |
|---|---|---|
| Data Source | Blockchain transaction data | Price and volume charts |
| Focus | Network activity and asset flow | Historical price patterns and trends |
| Tools Used | Wallet tracking, transaction volume, node analysis | Candlestick patterns, trendlines, support/resistance |
| Timeframe | Real-time to long-term blockchain data | Short-term to medium-term price movements |
| Key Metrics | Transaction count, active addresses, coin velocity | Pattern recognition, breakout points, volume changes |
| Primary Use | Assess asset fundamentals and market sentiment | Identify entry and exit points based on price action |
| Strengths | Objective, data-driven insights from blockchain | Visual, easy-to-understand price signals |
| Limitations | Complexity, requires deep blockchain knowledge | Subjective interpretation, prone to false signals |
Which is better?
On-chain analytics provides actionable insights by analyzing blockchain transaction data, offering real-time transparency into market sentiment, liquidity, and investor behavior that chart pattern analysis lacks. Chart pattern analysis relies on historical price movements to predict future trends but may be less effective during volatile or manipulated markets. Traders leveraging on-chain metrics combined with chart patterns often achieve more accurate predictions and improved risk management strategies in cryptocurrency trading.
Connection
On-chain analytics provide real-time blockchain data such as transaction volume, wallet activity, and token flow, which are crucial for confirming trends identified through chart pattern analysis. Chart patterns like head and shoulders or double tops can be validated by on-chain indicators that reveal underlying market sentiment and asset accumulation or distribution phases. Integrating these methodologies enhances trading decisions by combining technical price action insights with fundamental blockchain activity metrics.
Key Terms
**Chart pattern analysis:**
Chart pattern analysis involves studying historical price movements to identify formations such as head and shoulders, flags, or triangles that signal potential trend reversals or continuations. This method relies heavily on technical indicators and volume patterns to forecast market behavior and optimize entry and exit points. Explore more to understand how chart patterns can enhance your trading strategies.
Support and Resistance
Chart pattern analysis relies on historical price movements to identify support and resistance levels formed by recurring patterns such as triangles, head and shoulders, and double tops. On-chain analytics examines blockchain data, including transaction volumes and wallet activities, to detect underlying support and resistance through network behavior and asset distribution. Explore these methodologies further to enhance your market timing and investment strategies.
Head and Shoulders
Head and Shoulders is a widely recognized chart pattern in technical analysis signaling a trend reversal by depicting three peaks with the middle peak as the highest; on-chain analytics, however, offers transaction-level insights by examining blockchain data such as wallet addresses and token flows to validate market sentiment behind the pattern. Chart pattern analysis provides traders with visual cues for entry and exit points, while on-chain analytics uncovers the underlying behavior of market participants, enhancing decision-making accuracy. Explore more to understand how combining these methods strengthens market predictions.
Source and External Links
Learn basics & Types of Chart Patterns | Elearnmarkets - Chart pattern analysis classifies into reversal (indicating trend changes) and continuation patterns (signalling trend pauses), with examples like head and shoulders, double tops/bottoms for reversals, and triangles, flags for continuation, useful across time frames and supported by volume analysis.
Chart Patterns in Technical Analysis: A Comprehensive Guide - Oanda - Chart patterns reflect collective trader psychology and reactions to market events, helping predict price movements by identifying recurring formations developed from human behavioral patterns, despite sometimes forming from unclear reasons or rumors.
The Only CHART PATTERNS Technical Analysis & Trading Course ... - This course covers essential chart patterns like double tops/bottoms, triple tops/bottoms, head and shoulders, inverse head and shoulders, and channel patterns (ascending, descending, horizontal), highlighting how breakouts from these patterns signal potential bullish or bearish trend reversals or continuations.