High-frequency tick charts capture price movements by recording each transaction, offering granular insights into market activity for traders seeking precision in timing. Volume-based charts aggregate data based on traded shares, revealing trends tied directly to market participation levels and liquidity. Explore how choosing between tick and volume-based charts can enhance your trading strategies by understanding their distinct advantages.
Why it is important
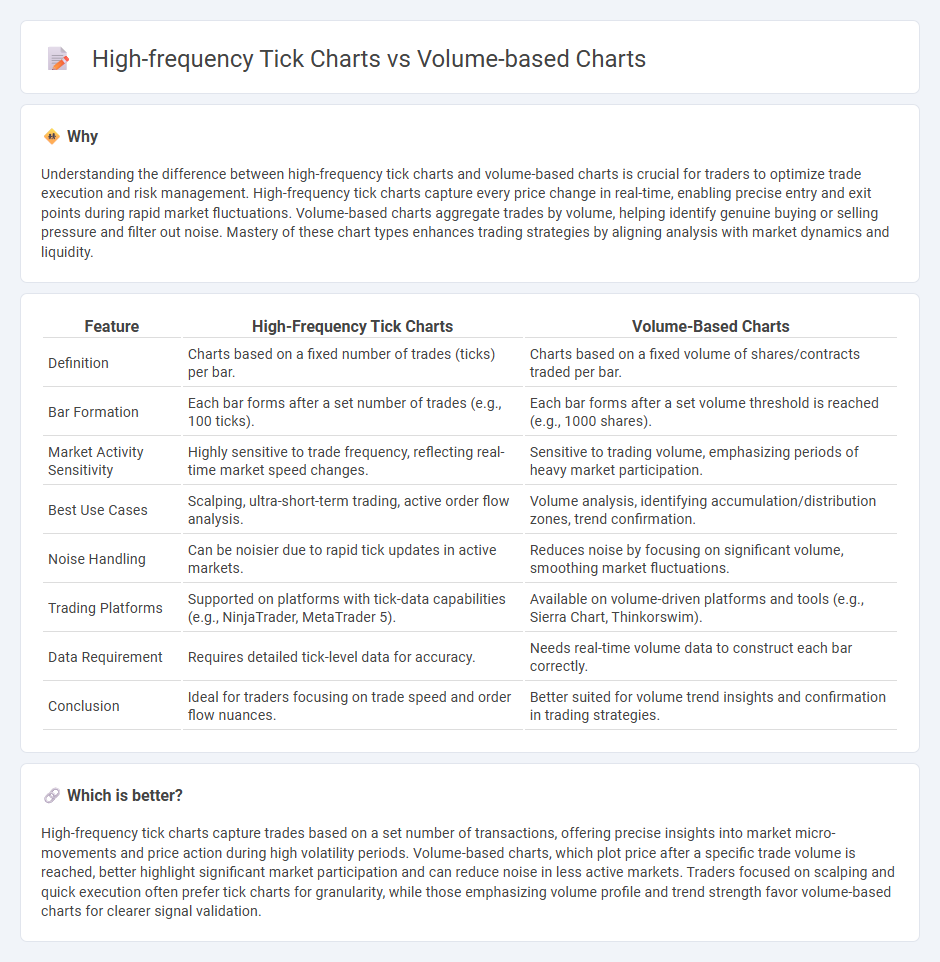
Understanding the difference between high-frequency tick charts and volume-based charts is crucial for traders to optimize trade execution and risk management. High-frequency tick charts capture every price change in real-time, enabling precise entry and exit points during rapid market fluctuations. Volume-based charts aggregate trades by volume, helping identify genuine buying or selling pressure and filter out noise. Mastery of these chart types enhances trading strategies by aligning analysis with market dynamics and liquidity.
Comparison Table
| Feature | High-Frequency Tick Charts | Volume-Based Charts |
|---|---|---|
| Definition | Charts based on a fixed number of trades (ticks) per bar. | Charts based on a fixed volume of shares/contracts traded per bar. |
| Bar Formation | Each bar forms after a set number of trades (e.g., 100 ticks). | Each bar forms after a set volume threshold is reached (e.g., 1000 shares). |
| Market Activity Sensitivity | Highly sensitive to trade frequency, reflecting real-time market speed changes. | Sensitive to trading volume, emphasizing periods of heavy market participation. |
| Best Use Cases | Scalping, ultra-short-term trading, active order flow analysis. | Volume analysis, identifying accumulation/distribution zones, trend confirmation. |
| Noise Handling | Can be noisier due to rapid tick updates in active markets. | Reduces noise by focusing on significant volume, smoothing market fluctuations. |
| Trading Platforms | Supported on platforms with tick-data capabilities (e.g., NinjaTrader, MetaTrader 5). | Available on volume-driven platforms and tools (e.g., Sierra Chart, Thinkorswim). |
| Data Requirement | Requires detailed tick-level data for accuracy. | Needs real-time volume data to construct each bar correctly. |
| Conclusion | Ideal for traders focusing on trade speed and order flow nuances. | Better suited for volume trend insights and confirmation in trading strategies. |
Which is better?
High-frequency tick charts capture trades based on a set number of transactions, offering precise insights into market micro-movements and price action during high volatility periods. Volume-based charts, which plot price after a specific trade volume is reached, better highlight significant market participation and can reduce noise in less active markets. Traders focused on scalping and quick execution often prefer tick charts for granularity, while those emphasizing volume profile and trend strength favor volume-based charts for clearer signal validation.
Connection
High-frequency tick charts and volume-based charts both capture market activity by focusing on transaction frequency rather than elapsed time, providing traders with granular insights into price movements. Tick charts plot price changes after a specific number of trades, while volume-based charts update with a set volume of shares or contracts traded, allowing for a dynamic view of market liquidity and momentum. By analyzing these charts, traders can identify short-term patterns and optimize entry and exit points in fast-paced trading environments.
Key Terms
Trade Volume
Volume-based charts aggregate data by trade volume, plotting a new bar or candle only after a predetermined amount of shares or contracts is traded, which highlights market participation intensity. High-frequency tick charts plot price movements based on a set number of trades, regardless of volume, capturing rapid market activity with fewer concerns about trade size. Explore how selecting between these chart types impacts trading strategies and market timing.
Tick Count
Volume-based charts aggregate price data by a predetermined number of trades, providing insights aligned with market participation and liquidity, while high-frequency tick charts emphasize rapid tick count changes to capture microstructural price movements. Tick count analysis in high-frequency charts allows traders to identify short-term momentum shifts and execute algorithmic strategies with precision. Explore deeper to understand how tick count influences trading efficiency and market timing strategies.
Time Independence
Volume-based charts aggregate price data by a fixed number of traded units, offering a clear view of market activity without relying on time intervals, which helps traders capture momentum during high-volume sessions. High-frequency tick charts plot trades at every specified number of transactions, providing precise insights into market microstructure and price fluctuations with minimal time bias. Explore the nuances between these chart types to enhance your trading strategies with a focus on time-independent analysis.
Source and External Links
Volume-Based Chart - TradeStation Help - A volume-based chart records price data (open, high, low, close) for a specified volume of shares traded, producing bars based on trading volume rather than fixed time intervals, which helps analyze volume-driven market activity.
Volume-by-Price - ChartSchool - StockCharts.com - Volume-by-Price is a chart overlay showing horizontal volume bars at specific price ranges, identifying high-volume price zones that act as support or resistance levels by combining volume and closing prices.
Volume Ladder - OverCharts - Volume Ladder is an order flow indicator that displays volume, bid/ask data, delta, and other volume statistics within each bar to enable precise and faster trading decisions through detailed volume analysis.