Options flow reveals real-time market sentiment by tracking large trades and unusual activity, often indicating institutional investor moves. Candlestick patterns analyze price action through visual chart formations to predict potential market reversals or continuations. Explore how combining options flow and candlestick patterns can enhance trading strategies and market timing.
Why it is important
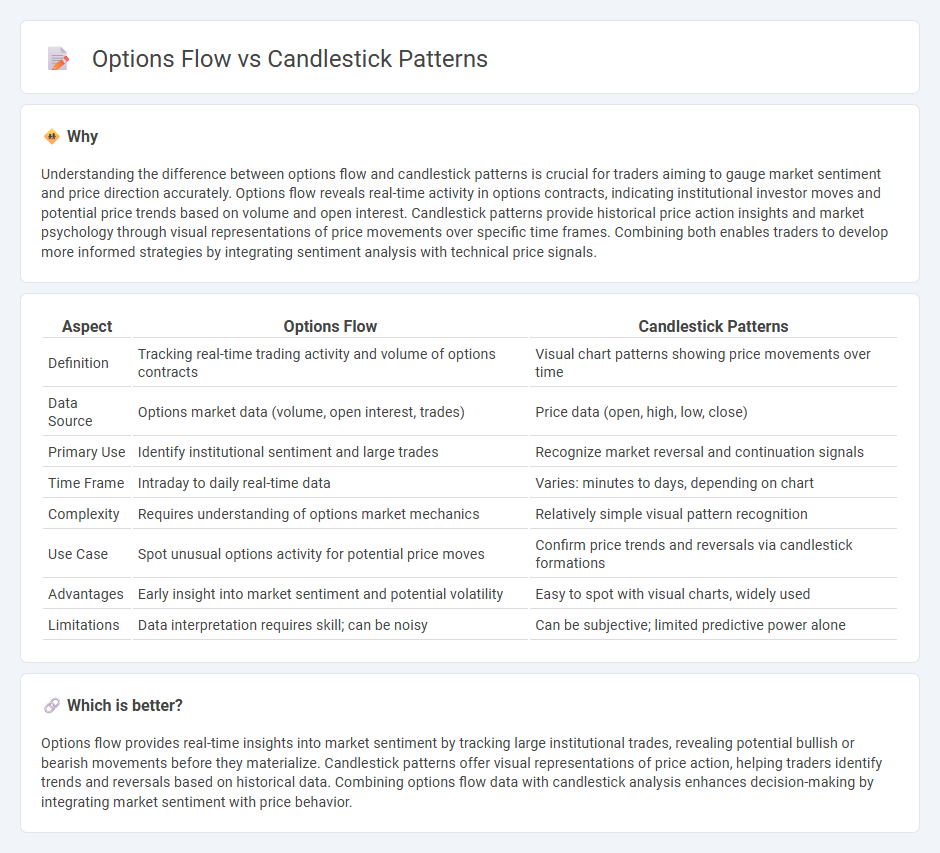
Understanding the difference between options flow and candlestick patterns is crucial for traders aiming to gauge market sentiment and price direction accurately. Options flow reveals real-time activity in options contracts, indicating institutional investor moves and potential price trends based on volume and open interest. Candlestick patterns provide historical price action insights and market psychology through visual representations of price movements over specific time frames. Combining both enables traders to develop more informed strategies by integrating sentiment analysis with technical price signals.
Comparison Table
| Aspect | Options Flow | Candlestick Patterns |
|---|---|---|
| Definition | Tracking real-time trading activity and volume of options contracts | Visual chart patterns showing price movements over time |
| Data Source | Options market data (volume, open interest, trades) | Price data (open, high, low, close) |
| Primary Use | Identify institutional sentiment and large trades | Recognize market reversal and continuation signals |
| Time Frame | Intraday to daily real-time data | Varies: minutes to days, depending on chart |
| Complexity | Requires understanding of options market mechanics | Relatively simple visual pattern recognition |
| Use Case | Spot unusual options activity for potential price moves | Confirm price trends and reversals via candlestick formations |
| Advantages | Early insight into market sentiment and potential volatility | Easy to spot with visual charts, widely used |
| Limitations | Data interpretation requires skill; can be noisy | Can be subjective; limited predictive power alone |
Which is better?
Options flow provides real-time insights into market sentiment by tracking large institutional trades, revealing potential bullish or bearish movements before they materialize. Candlestick patterns offer visual representations of price action, helping traders identify trends and reversals based on historical data. Combining options flow data with candlestick analysis enhances decision-making by integrating market sentiment with price behavior.
Connection
Options flow reveals market sentiment by tracking large option trades, which often precede significant price movements identified through candlestick patterns. Analyzing options flow alongside candlestick formations like engulfing or hammer patterns enhances predictions of potential reversals or continuations in asset price trends. Integrating these signals enables traders to improve timing and accuracy in entering or exiting trades within volatile markets.
Key Terms
**Candlestick Patterns:**
Candlestick patterns provide traders with visual insights into market sentiment by illustrating price movements and potential reversals based on open, high, low, and close data. Key patterns such as Doji, Hammer, and Engulfing signals help identify trend continuation or reversal opportunities in various timeframes. Explore these candlestick formations to enhance your technical analysis and trading strategies.
Doji
The Doji candlestick pattern, characterized by its small body and nearly equal open and close prices, signals market indecision and potential trend reversals in technical analysis. Options flow, which tracks real-time buying and selling of options contracts, complements this by revealing trader sentiment and large speculative moves that can confirm Doji indications. Explore our in-depth analysis to understand how combining Doji patterns with options flow enhances trading strategies.
Engulfing
Engulfing candlestick patterns signal strong market reversals by indicating buyers or sellers overwhelming the opposing side, making them crucial for technical analysis. Options flow reveals large volume trades and shifts in market sentiment, complementing the visual cues of an engulfing pattern by adding insights into trader behavior. Explore the interplay between engulfing patterns and options flow to enhance your trading strategy.
Source and External Links
40 Powerful Candlestick Patterns: Trading Guide for Beginners - Strike - Candlestick patterns, such as the Morning Star and Morning Star Doji, are categorized primarily as bullish reversal signals with significant success rates in forecasting trend changes, aiding traders in identifying market momentum shifts.
16 Candlestick Patterns Every Trader Should Know | IG International - Essential candlestick patterns include bearish reversals like the Dark Cloud Cover and neutral patterns such as Doji and Spinning Top, which indicate market indecision or continuation and help traders interpret price action dynamics.
THE CANDLESTICK TRADING BIBLE - Candlestick patterns represent market psychology, with key reversal shapes like the Hammer indicating buying pressure and potential trend reversals after downtrends, crucial for understanding market sentiment and momentum shifts.