Volume profile reading reveals the distribution of traded volume at various price levels, highlighting areas of high liquidity and potential support or resistance zones. Trendlines focus on price action by connecting swing highs or lows to identify directional momentum and potential breakout points. Explore these complementary tools to enhance your trading strategy and market analysis.
Why it is important
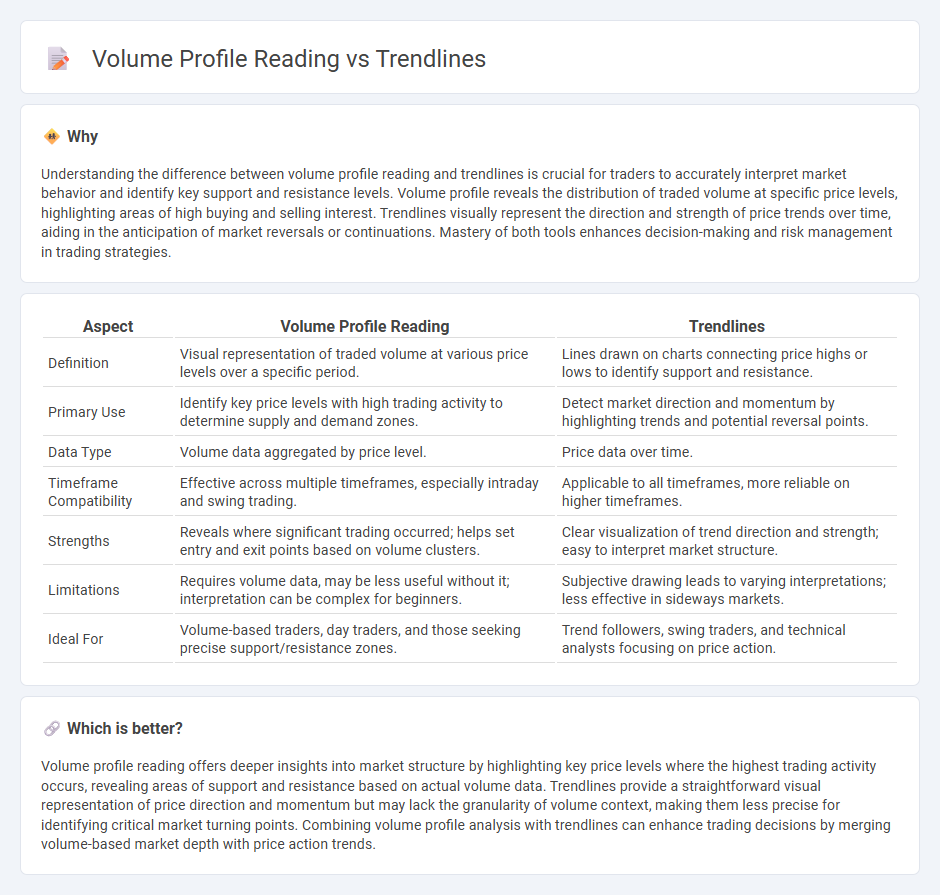
Understanding the difference between volume profile reading and trendlines is crucial for traders to accurately interpret market behavior and identify key support and resistance levels. Volume profile reveals the distribution of traded volume at specific price levels, highlighting areas of high buying and selling interest. Trendlines visually represent the direction and strength of price trends over time, aiding in the anticipation of market reversals or continuations. Mastery of both tools enhances decision-making and risk management in trading strategies.
Comparison Table
| Aspect | Volume Profile Reading | Trendlines |
|---|---|---|
| Definition | Visual representation of traded volume at various price levels over a specific period. | Lines drawn on charts connecting price highs or lows to identify support and resistance. |
| Primary Use | Identify key price levels with high trading activity to determine supply and demand zones. | Detect market direction and momentum by highlighting trends and potential reversal points. |
| Data Type | Volume data aggregated by price level. | Price data over time. |
| Timeframe Compatibility | Effective across multiple timeframes, especially intraday and swing trading. | Applicable to all timeframes, more reliable on higher timeframes. |
| Strengths | Reveals where significant trading occurred; helps set entry and exit points based on volume clusters. | Clear visualization of trend direction and strength; easy to interpret market structure. |
| Limitations | Requires volume data, may be less useful without it; interpretation can be complex for beginners. | Subjective drawing leads to varying interpretations; less effective in sideways markets. |
| Ideal For | Volume-based traders, day traders, and those seeking precise support/resistance zones. | Trend followers, swing traders, and technical analysts focusing on price action. |
Which is better?
Volume profile reading offers deeper insights into market structure by highlighting key price levels where the highest trading activity occurs, revealing areas of support and resistance based on actual volume data. Trendlines provide a straightforward visual representation of price direction and momentum but may lack the granularity of volume context, making them less precise for identifying critical market turning points. Combining volume profile analysis with trendlines can enhance trading decisions by merging volume-based market depth with price action trends.
Connection
Volume profile reading identifies price levels with high trading activity, highlighting areas of support and resistance crucial for trendline accuracy. Trendlines drawn through price points aligned with significant volume clusters confirm strength and reliability of market direction. Combining volume profile data with trendline analysis enhances trade timing and decision-making precision.
Key Terms
Support and Resistance
Trendlines provide a visual representation of support and resistance levels by connecting sequential highs or lows, helping traders identify potential price reversals or continuations. Volume Profile reading enhances this analysis by displaying the distribution of traded volume at various price levels, highlighting areas of high liquidity and strong market interest that often correspond to key support and resistance zones. Explore detailed techniques to combine trendlines and Volume Profile for more precise market timing and risk management strategies.
Price Action
Trendlines provide a visual representation of price action by connecting significant highs and lows, highlighting potential support and resistance levels, while volume profile reading offers insight into the concentration of trading activity at specific price levels, revealing market acceptance and rejection zones. Combining trendlines with volume profile analysis enhances the understanding of price behavior, improving trade entry and exit decisions based on genuine market momentum and volume confirmation. Explore advanced price action strategies to master the integration of trendlines and volume profile for actionable market insights.
Value Area
Trendlines provide visual support and resistance levels based on price action, whereas volume profile reading highlights areas of significant trading activity by plotting volume across price levels. The Value Area, a key concept in volume profile, represents the price range where around 70% of the volume was traded, indicating high market acceptance and potential support or resistance zones. To deepen your understanding of Value Area analysis and its advantages over trendline methods, explore advanced volume profile strategies.
Source and External Links
Trend Lines: Definition, Importance and How To Draw It? - Strike - Trendlines are custom lines drawn on price charts to connect price points and illustrate trends, including types like linear, exponential, logarithmic, polynomial, and moving average trend lines, each suitable for different data characteristics.
Trend Lines - ChartSchool - StockCharts.com - Trend lines are straight lines connecting two or more price points used in technical analysis to identify and confirm market trends, acting as visual support and resistance and helping traders anticipate price movements.
Trend line (technical analysis) - Wikipedia - In finance, trend lines are diagonal lines drawn between at least three price pivot points to judge entry and exit timing in trading, representing support or resistance levels and widely used in technical analysis.