Order flow footprint charts provide a detailed visual representation of buy and sell orders at specific price levels, enabling traders to analyze market liquidity and identify potential support or resistance zones. Time and Sales data offer a real-time transaction log, showing exact trade sizes, prices, and times, which helps in understanding market momentum and order aggressiveness. Explore these tools further to enhance your trading precision and market insight.
Why it is important
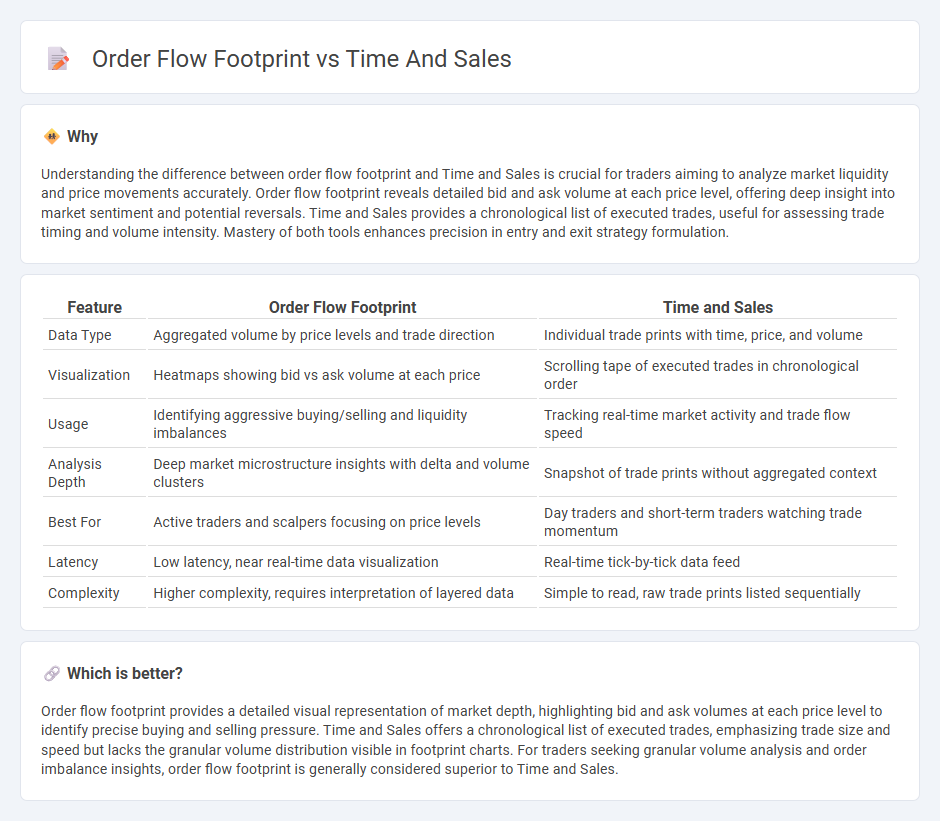
Understanding the difference between order flow footprint and Time and Sales is crucial for traders aiming to analyze market liquidity and price movements accurately. Order flow footprint reveals detailed bid and ask volume at each price level, offering deep insight into market sentiment and potential reversals. Time and Sales provides a chronological list of executed trades, useful for assessing trade timing and volume intensity. Mastery of both tools enhances precision in entry and exit strategy formulation.
Comparison Table
| Feature | Order Flow Footprint | Time and Sales |
|---|---|---|
| Data Type | Aggregated volume by price levels and trade direction | Individual trade prints with time, price, and volume |
| Visualization | Heatmaps showing bid vs ask volume at each price | Scrolling tape of executed trades in chronological order |
| Usage | Identifying aggressive buying/selling and liquidity imbalances | Tracking real-time market activity and trade flow speed |
| Analysis Depth | Deep market microstructure insights with delta and volume clusters | Snapshot of trade prints without aggregated context |
| Best For | Active traders and scalpers focusing on price levels | Day traders and short-term traders watching trade momentum |
| Latency | Low latency, near real-time data visualization | Real-time tick-by-tick data feed |
| Complexity | Higher complexity, requires interpretation of layered data | Simple to read, raw trade prints listed sequentially |
Which is better?
Order flow footprint provides a detailed visual representation of market depth, highlighting bid and ask volumes at each price level to identify precise buying and selling pressure. Time and Sales offers a chronological list of executed trades, emphasizing trade size and speed but lacks the granular volume distribution visible in footprint charts. For traders seeking granular volume analysis and order imbalance insights, order flow footprint is generally considered superior to Time and Sales.
Connection
Order flow footprint and Time and Sales are interconnected tools that provide real-time market transaction data essential for trading analysis. Order flow footprint charts display detailed volume and price action within each price bar, while Time and Sales offers a chronological list of individual trades, including size, price, and time. Combined, these tools enable traders to precisely interpret market liquidity, identify buying and selling pressure, and make informed trading decisions.
Key Terms
Print (Trade Tape)
Time and Sales data offers a detailed chronological record of executed trades, capturing price, volume, and time, crucial for analyzing market liquidity and identifying large prints or iceberg orders. Order flow footprint charts enhance this by visually representing bid and ask volume at each price level, highlighting trade imbalances and revealing market participant behavior more granularly than the simple trade tape. Explore deeper insights into market dynamics by understanding how these tools complement each other in real-time trading analysis.
Bid/Ask Volume
Time and Sales data provides a real-time list of executed trades highlighting bid/ask prices and volumes, crucial for capturing market momentum. Order flow footprint charts visually represent bid and ask volume at each price level, revealing detailed market depth and liquidity dynamics. Explore how mastering bid/ask volume analysis can enhance your trading strategy in dynamic markets.
Imbalance
Time and Sales provides a detailed list of executed trades reflecting actual market transactions, while the order flow footprint chart visualizes volume distribution at each price level, highlighting imbalances between buyers and sellers. Imbalance analysis identifies areas where aggressive buying or selling dominates, signaling potential support or resistance zones critical for trade decisions. Explore more to understand how leveraging order flow imbalances can enhance market timing and trading strategies.
Source and External Links
Time and Sales: How to Read the Tape Like a Pro - Warrior Trading - Time and Sales, also called "the tape," is a detailed record of all stock trades during the day, showing time, price, and trade size, which traders use to gauge supply and demand shifts in the market by analyzing executed trade prints at bid or ask prices.
Time and Sales for Traders - The Complete Guide - Time and Sales is a real-time running log of all trades for a stock, used by traders to gauge activity, demand, and potential price changes by analyzing trade prints with time, price, and volume data, including color codes indicating trades at bid or ask prices.
Time & Sales Overview - TT Help Library - Trading Technologies - The Time & Sales widget displays real-time and historical trades for selected instruments, detailing each trade's date, time, price, and quantity, with color coding to show whether trades resulted from aggressive buying or selling.