Footprint charts provide detailed market data by displaying volume at each price level within a candlestick, helping traders analyze buying and selling pressure with precision. Tick charts, on the other hand, generate a new bar after a set number of transactions, offering insights into market activity based on trade frequency rather than time intervals. Explore more to understand how these chart types can enhance your trading strategy and decision-making.
Why it is important
Understanding the difference between footprint charts and tick charts is crucial for traders to accurately analyze market order flow and volume distribution. Footprint charts provide detailed insights into bid and ask volumes at each price level, revealing market sentiment and potential support or resistance zones. Tick charts display a fixed number of transactions per bar, offering a dynamic view of market activity regardless of time. Mastering both chart types enhances trade timing, risk management, and decision-making precision in volatile markets.
Comparison Table
| Feature | Footprint Charts | Tick Charts |
|---|---|---|
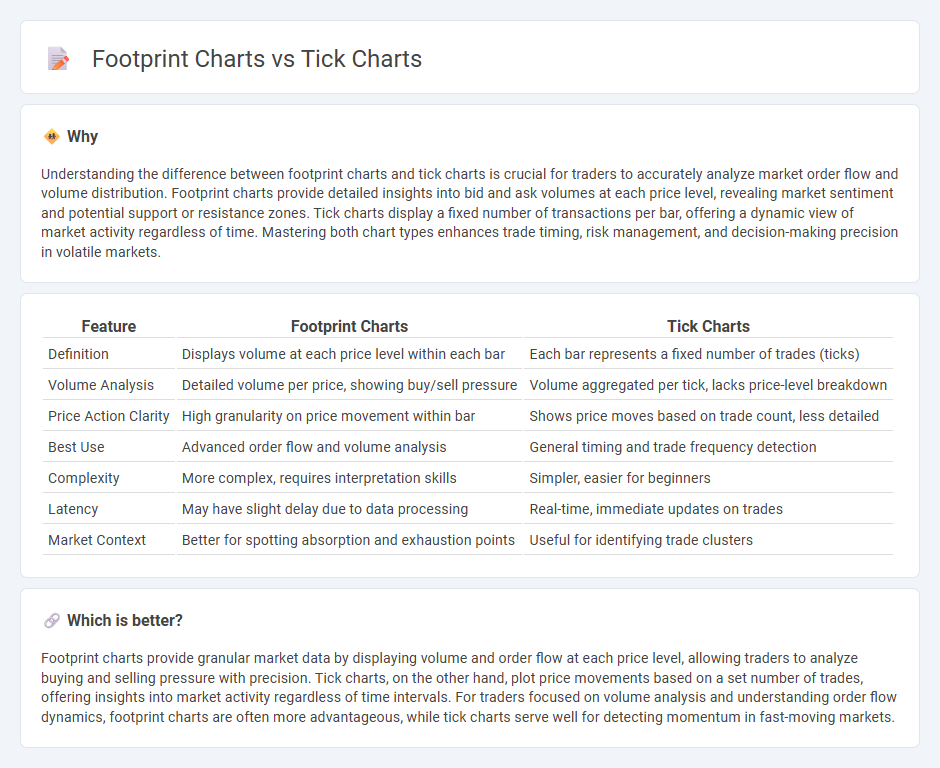
| Definition | Displays volume at each price level within each bar | Each bar represents a fixed number of trades (ticks) |
| Volume Analysis | Detailed volume per price, showing buy/sell pressure | Volume aggregated per tick, lacks price-level breakdown |
| Price Action Clarity | High granularity on price movement within bar | Shows price moves based on trade count, less detailed |
| Best Use | Advanced order flow and volume analysis | General timing and trade frequency detection |
| Complexity | More complex, requires interpretation skills | Simpler, easier for beginners |
| Latency | May have slight delay due to data processing | Real-time, immediate updates on trades |
| Market Context | Better for spotting absorption and exhaustion points | Useful for identifying trade clusters |
Which is better?
Footprint charts provide granular market data by displaying volume and order flow at each price level, allowing traders to analyze buying and selling pressure with precision. Tick charts, on the other hand, plot price movements based on a set number of trades, offering insights into market activity regardless of time intervals. For traders focused on volume analysis and understanding order flow dynamics, footprint charts are often more advantageous, while tick charts serve well for detecting momentum in fast-moving markets.
Connection
Footprint charts visualize market order flow by displaying detailed volume data at each price level, enabling traders to analyze buying and selling pressure more precisely. Tick charts represent price movements based on a specific number of trades, providing a granular view of market activity regardless of time intervals. Both footprint and tick charts enhance trading strategies by offering deeper insights into market dynamics through volume and trade frequency analysis.
Key Terms
Order Flow
Tick charts display price movements based on a set number of trades, offering precise insights into market activity and allowing traders to monitor volume and order flow efficiently. Footprint charts provide a detailed representation of volume traded at each price level within a single bar, highlighting bid-ask imbalances and helping identify buying or selling pressure. Explore how leveraging both tick and footprint charts enhances your order flow analysis for better trading decisions.
Volume
Tick charts display price action based on a set number of trades, offering detailed insights into market activity and short-term volume fluctuations. Footprint charts provide a granular view of volume by showing the exact buy and sell orders at each price level, enabling traders to analyze order flow and market balance. Explore how volume-focused charting techniques can enhance your trading strategy with deeper market transparency.
Price Action
Tick charts display a set number of transactions per bar, providing detailed insight into market activity and trading volume at specific price levels. Footprint charts break down price action by showing bid and ask volumes within each price bar, revealing order flow and buyer-seller dynamics. Explore our guide to better understand which chart type enhances your price action analysis and trading strategy.
Source and External Links
Introducing tick charts (beta) -- TradingView Blog - Tick charts create bars based on a specific number of trades rather than fixed time intervals, providing a granular and real-time view of market activity to help traders identify trends and volume spikes more clearly.
Tick Size in Trading: Definition, How it Works & Why it Matters - Tick charts plot a new candle after a set number of trades, allowing traders to filter out market noise and capture rapid price movements during high volume, offering advantages like customized strategies and clearer real-time insights.
Tick Charts Complete Guide: Settings & Platform Setup (2025) - Tick charts form bars based on a fixed number of trades, not time, which highlights professional trader activity and is especially useful in volatile markets, though support varies across trading platforms.