Smart Money Concepts focus on tracking the activities of institutional investors and market makers to anticipate price movements, emphasizing volume and order flow analysis. Technical Indicators rely on mathematical calculations derived from historical price and volume data to identify trends and potential entry or exit points. Explore the differences between these approaches to enhance your trading strategy and market understanding.
Why it is important
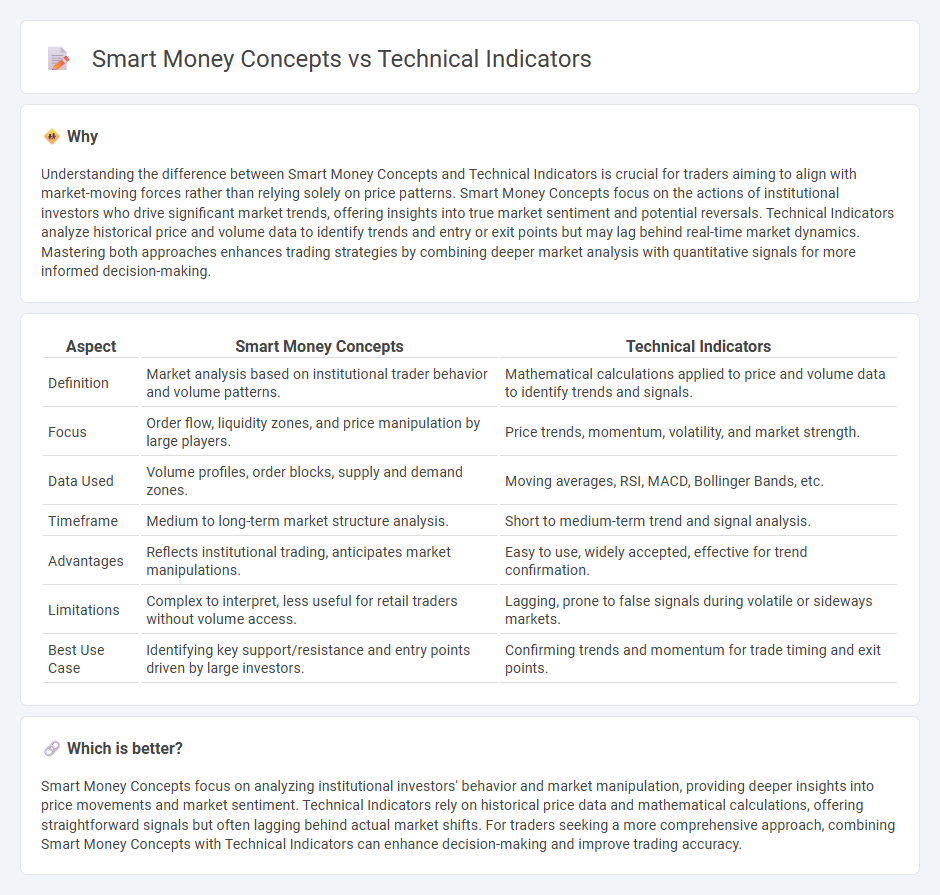
Understanding the difference between Smart Money Concepts and Technical Indicators is crucial for traders aiming to align with market-moving forces rather than relying solely on price patterns. Smart Money Concepts focus on the actions of institutional investors who drive significant market trends, offering insights into true market sentiment and potential reversals. Technical Indicators analyze historical price and volume data to identify trends and entry or exit points but may lag behind real-time market dynamics. Mastering both approaches enhances trading strategies by combining deeper market analysis with quantitative signals for more informed decision-making.
Comparison Table
| Aspect | Smart Money Concepts | Technical Indicators |
|---|---|---|
| Definition | Market analysis based on institutional trader behavior and volume patterns. | Mathematical calculations applied to price and volume data to identify trends and signals. |
| Focus | Order flow, liquidity zones, and price manipulation by large players. | Price trends, momentum, volatility, and market strength. |
| Data Used | Volume profiles, order blocks, supply and demand zones. | Moving averages, RSI, MACD, Bollinger Bands, etc. |
| Timeframe | Medium to long-term market structure analysis. | Short to medium-term trend and signal analysis. |
| Advantages | Reflects institutional trading, anticipates market manipulations. | Easy to use, widely accepted, effective for trend confirmation. |
| Limitations | Complex to interpret, less useful for retail traders without volume access. | Lagging, prone to false signals during volatile or sideways markets. |
| Best Use Case | Identifying key support/resistance and entry points driven by large investors. | Confirming trends and momentum for trade timing and exit points. |
Which is better?
Smart Money Concepts focus on analyzing institutional investors' behavior and market manipulation, providing deeper insights into price movements and market sentiment. Technical Indicators rely on historical price data and mathematical calculations, offering straightforward signals but often lagging behind actual market shifts. For traders seeking a more comprehensive approach, combining Smart Money Concepts with Technical Indicators can enhance decision-making and improve trading accuracy.
Connection
Smart money concepts leverage technical indicators like moving averages, volume analysis, and support/resistance levels to identify institutional trading patterns and market trends. Technical indicators provide quantitative signals that help traders interpret smart money moves, enhancing trade entry and exit decisions. Integrating these tools allows for improved market timing and risk management, aligning retail strategies with the behavior of professional investors.
Key Terms
Moving Average (Technical Indicator)
Moving Average, a widely-used technical indicator, smooths price data to identify trends by calculating the average asset price over a specific period, aiding traders in spotting entry and exit points. Smart money concepts focus on analyzing the behavior of institutional investors through price action and volume patterns, providing insights beyond traditional indicators like Moving Averages. Explore the differences and advantages of integrating Moving Average analysis with smart money concepts to enhance your trading strategy.
Order Blocks (Smart Money Concept)
Order Blocks in Smart Money Concepts represent consolidated price areas where institutional traders place large orders, signaling potential market reversals or continuations. Unlike traditional Technical Indicators, which rely on historical price and volume data for trend analysis, Order Blocks provide insights into market manipulation and liquidity zones critical for predicting major price movements. Explore how integrating Order Blocks into your trading strategy can enhance market timing and improve decision-making accuracy.
Liquidity Pools (Smart Money Concept)
Liquidity pools in Smart Money Concepts represent zones where large institutional traders accumulate or distribute assets, creating significant price movements often missed by conventional Technical Indicators such as Moving Averages or RSI. These pools act as magnets for price action, revealing areas of high trading volume and potential reversals that traditional indicators may fail to detect due to lagging data. Explore deeper strategies on leveraging Liquidity Pools to enhance trading precision and market insight.
Source and External Links
Technical Indicator - Definition, Uses, Best Types - A technical indicator is a mathematical pattern derived from historical data, such as price and volume, used by traders to predict future price trends and make trading decisions, often shown graphically to compare with price charts for analyzing market trends and investor psychology.
Technical Analysis Indicators | NCFE - Technical indicators use mathematical formulas on price and/or volume data to identify bullish or bearish market trends and forecast probable price changes, categorized mainly as volume, trend/momentum, and oscillator indicators.
Understanding the 4 Types of Technical Indicators - Altrady - Technical indicators fall into four main categories--oscillators, trend-following, volume, and volatility indicators--and provide graphical insights that traders use to assess the strength and direction of price movements, especially useful in cryptocurrency markets.