Quantitative signals leverage mathematical models and statistical analysis to identify trading opportunities based on price patterns and market data. Momentum trading focuses on capitalizing on the continuation of existing market trends by tracking asset price momentum and volume. Explore the key differences and advantages of these strategies to enhance your trading approach.
Why it is important
Understanding the difference between quantitative signals and momentum trading is crucial for developing effective trading strategies that maximize returns and manage risks. Quantitative signals use mathematical models and statistical analysis to identify trading opportunities, whereas momentum trading relies on the strength and direction of price trends. Knowing these distinctions enables traders to select appropriate tools for market conditions and optimize portfolio performance. Integrating quantitative signals with momentum analysis can enhance decision-making and improve profitability in volatile markets.
Comparison Table
| Aspect | Quantitative Signals | Momentum Trading |
|---|---|---|
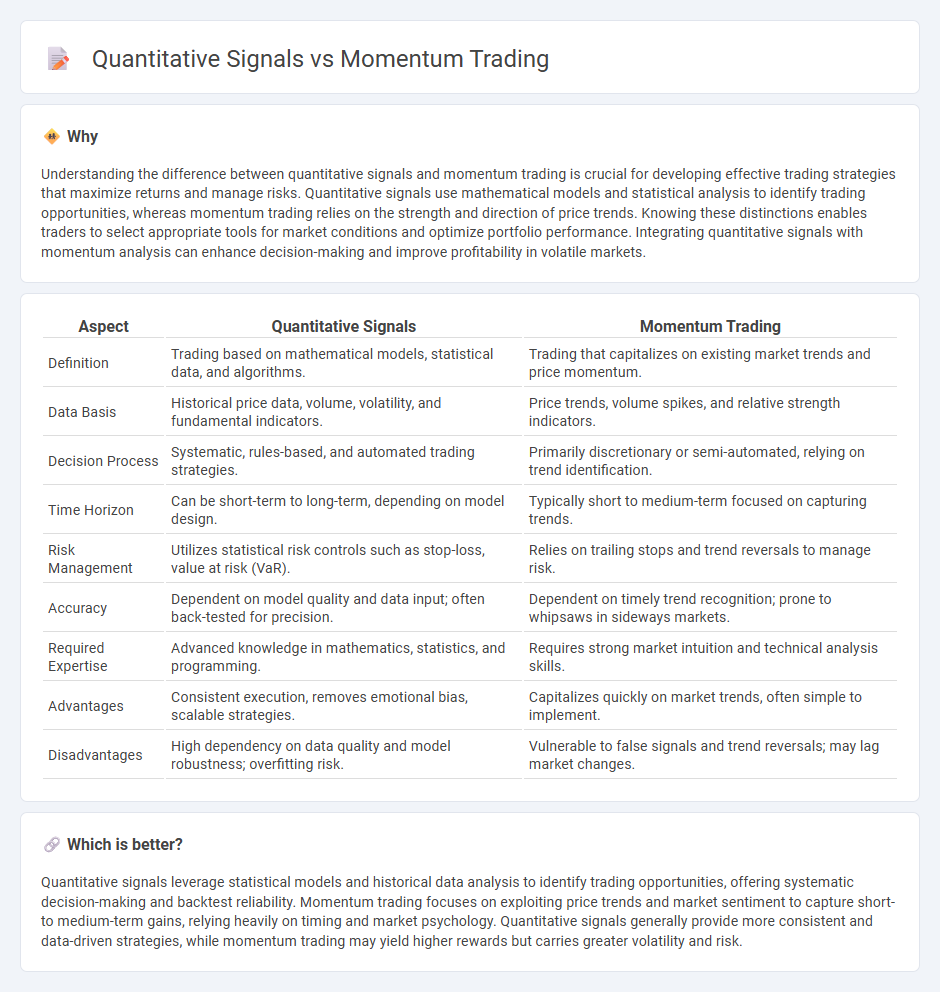
| Definition | Trading based on mathematical models, statistical data, and algorithms. | Trading that capitalizes on existing market trends and price momentum. |
| Data Basis | Historical price data, volume, volatility, and fundamental indicators. | Price trends, volume spikes, and relative strength indicators. |
| Decision Process | Systematic, rules-based, and automated trading strategies. | Primarily discretionary or semi-automated, relying on trend identification. |
| Time Horizon | Can be short-term to long-term, depending on model design. | Typically short to medium-term focused on capturing trends. |
| Risk Management | Utilizes statistical risk controls such as stop-loss, value at risk (VaR). | Relies on trailing stops and trend reversals to manage risk. |
| Accuracy | Dependent on model quality and data input; often back-tested for precision. | Dependent on timely trend recognition; prone to whipsaws in sideways markets. |
| Required Expertise | Advanced knowledge in mathematics, statistics, and programming. | Requires strong market intuition and technical analysis skills. |
| Advantages | Consistent execution, removes emotional bias, scalable strategies. | Capitalizes quickly on market trends, often simple to implement. |
| Disadvantages | High dependency on data quality and model robustness; overfitting risk. | Vulnerable to false signals and trend reversals; may lag market changes. |
Which is better?
Quantitative signals leverage statistical models and historical data analysis to identify trading opportunities, offering systematic decision-making and backtest reliability. Momentum trading focuses on exploiting price trends and market sentiment to capture short- to medium-term gains, relying heavily on timing and market psychology. Quantitative signals generally provide more consistent and data-driven strategies, while momentum trading may yield higher rewards but carries greater volatility and risk.
Connection
Quantitative signals harness statistical models and historical price data to identify momentum trends, providing traders with objective criteria for entry and exit points. Momentum trading relies on these quantifiable indicators to capitalize on the persistence of asset price movements, enhancing decision-making through systematic analysis. The integration of quantitative signals in momentum strategies increases the precision and effectiveness of capturing market trends.
Key Terms
**Momentum Trading:**
Momentum trading leverages price trends and volume data to identify stocks with sustained upward or downward movements, using indicators like moving averages and relative strength index (RSI) for entry and exit points. Traders rely on historical price momentum to capitalize on continued market direction, often employing stop-loss orders to manage risk. Discover how momentum trading strategies can enhance your portfolio performance by exploring advanced techniques and real-time data applications.
Relative Strength
Momentum trading leverages the Relative Strength Index (RSI) to identify stocks exhibiting strong price trends, capitalizing on their potential to continue moving in the same direction. Quantitative signals, incorporating a combination of mathematical models and Relative Strength metrics, provide a systematic approach to detect trading opportunities with reduced emotional bias. Explore more insights on how to optimize trading strategies using Relative Strength and quantitative indicators.
Trend Following
Momentum trading leverages price trends and market momentum to identify buy or sell opportunities, emphasizing recent asset performance for decision-making. Quantitative signals in trend following utilize mathematical models and algorithms to systematically capture market trends and reduce emotional bias. Explore how these approaches work together to enhance trading strategies and optimize returns.
Source and External Links
Momentum Trading: Types, Strategies and More - Part I - Momentum trading involves buying or selling assets based on recent price trends, with two main types: time-series momentum, which focuses on an asset's own historical performance, and cross-sectional momentum, which ranks assets against each other within a group to trade top performers.
Momentum Trading: Types, Strategies, and More - QuantInsti Blog - Momentum trading strategies aim to capitalize on continuing price trends by either buying assets with strong recent gains (time-series) or buying top performers relative to peers (cross-sectional), using assessment periods like 3, 6, or 12 months to generate trade signals.
Momentum Trading for Beginners (What They Don't Teach You) - This video explains momentum trading as following strong price moves in markets such as stocks, crypto, and forex, emphasizing trading with strength, using volume and volatility as indicators, and applying tools like RSI and MACD along with solid risk management.