Order flow analysis focuses on real-time transaction data to gauge market sentiment and liquidity, providing traders with insights into actual buying and selling activity. Technical analysis relies on historical price patterns and indicators to forecast future market movements based on trends and momentum. Explore the strengths and applications of both methods to enhance your trading strategy.
Why it is important
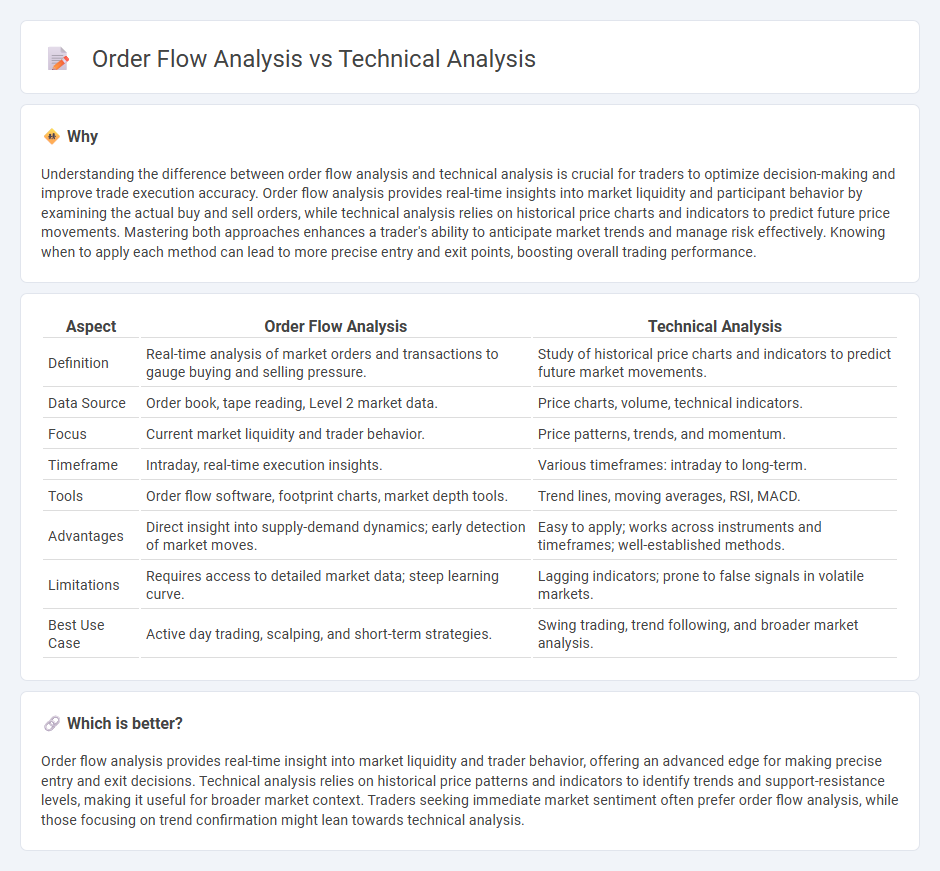
Understanding the difference between order flow analysis and technical analysis is crucial for traders to optimize decision-making and improve trade execution accuracy. Order flow analysis provides real-time insights into market liquidity and participant behavior by examining the actual buy and sell orders, while technical analysis relies on historical price charts and indicators to predict future price movements. Mastering both approaches enhances a trader's ability to anticipate market trends and manage risk effectively. Knowing when to apply each method can lead to more precise entry and exit points, boosting overall trading performance.
Comparison Table
| Aspect | Order Flow Analysis | Technical Analysis |
|---|---|---|
| Definition | Real-time analysis of market orders and transactions to gauge buying and selling pressure. | Study of historical price charts and indicators to predict future market movements. |
| Data Source | Order book, tape reading, Level 2 market data. | Price charts, volume, technical indicators. |
| Focus | Current market liquidity and trader behavior. | Price patterns, trends, and momentum. |
| Timeframe | Intraday, real-time execution insights. | Various timeframes: intraday to long-term. |
| Tools | Order flow software, footprint charts, market depth tools. | Trend lines, moving averages, RSI, MACD. |
| Advantages | Direct insight into supply-demand dynamics; early detection of market moves. | Easy to apply; works across instruments and timeframes; well-established methods. |
| Limitations | Requires access to detailed market data; steep learning curve. | Lagging indicators; prone to false signals in volatile markets. |
| Best Use Case | Active day trading, scalping, and short-term strategies. | Swing trading, trend following, and broader market analysis. |
Which is better?
Order flow analysis provides real-time insight into market liquidity and trader behavior, offering an advanced edge for making precise entry and exit decisions. Technical analysis relies on historical price patterns and indicators to identify trends and support-resistance levels, making it useful for broader market context. Traders seeking immediate market sentiment often prefer order flow analysis, while those focusing on trend confirmation might lean towards technical analysis.
Connection
Order flow analysis provides real-time insight into market liquidity and trader behavior by examining the actual buy and sell orders, which complements technical analysis that studies historical price patterns and indicators. Combining order flow data with technical analysis enhances trade timing accuracy and risk management by validating signals and identifying market momentum shifts. This integration helps traders anticipate price movements more effectively and make informed decisions based on both market depth and chart patterns.
Key Terms
**Technical Analysis:**
Technical analysis relies on chart patterns, moving averages, and indicators like RSI and MACD to predict price movements based on historical data. It emphasizes trend identification, support and resistance levels, and volume analysis to inform trading decisions. Explore more strategies and tools to deepen your understanding of technical analysis.
Chart Patterns
Technical analysis relies on chart patterns such as head and shoulders, triangles, and double tops to predict price movements by interpreting historical price and volume data. Order flow analysis, in contrast, examines real-time buy and sell orders and market depth to understand the supply-demand dynamics behind price changes. Explore more about how these methods can complement each other to enhance trading strategies.
Indicators
Technical analysis primarily relies on historical price data and indicators such as moving averages, RSI, and MACD to identify trends and potential entry points. Order flow analysis, on the other hand, examines real-time market transactions and liquidity through tools like the Depth of Market (DOM) and volume profiles to gauge buying and selling pressures. Explore deeper insights into these methodologies to refine your trading strategy and enhance decision-making accuracy.
Source and External Links
Technical Analysis - A Beginner's Guide - Corporate Finance Institute - Technical analysis is a method used to predict the probable future price movement of a security based on past market data, with traders analyzing price charts across different time frames to identify trends and entry points.
Beginners Guide to Technical Analysis | Learn to Trade - Oanda - Technical analysis studies the price of an asset using historical charts and tools like moving averages and oscillators to identify trends, support, and resistance zones that often repeat over time.
Technical analysis - Wikipedia - Technical analysis involves forecasting price directions through the study of past market data, based on the principle that all relevant information is reflected in prices and that prices move in identifiable trends due to investor behavior.