Alternative data signals leverage non-traditional information sources such as social media trends, satellite imagery, and consumer transaction data to provide traders with unique market insights often missed by conventional methods. Technical analysis signals rely on historical price patterns, volume, and chart indicators to predict future market movements based on established mathematical models. Explore the evolving landscape of trading by understanding how these distinct signal types can complement each other for enhanced decision-making.
Why it is important
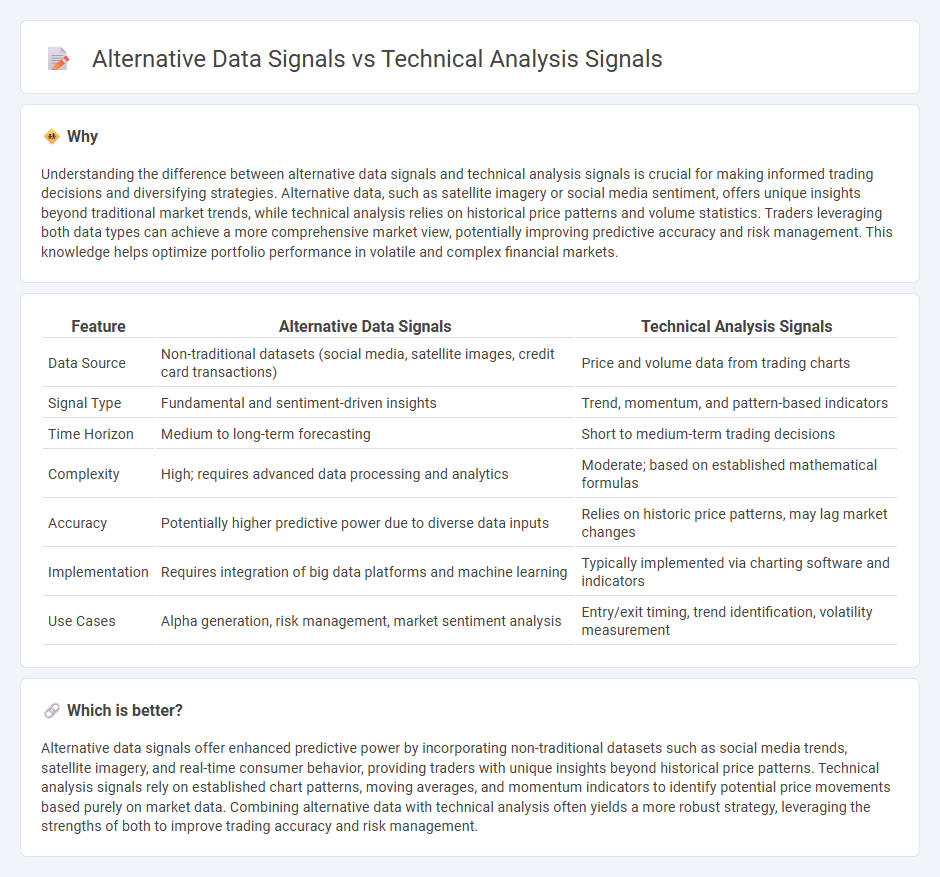
Understanding the difference between alternative data signals and technical analysis signals is crucial for making informed trading decisions and diversifying strategies. Alternative data, such as satellite imagery or social media sentiment, offers unique insights beyond traditional market trends, while technical analysis relies on historical price patterns and volume statistics. Traders leveraging both data types can achieve a more comprehensive market view, potentially improving predictive accuracy and risk management. This knowledge helps optimize portfolio performance in volatile and complex financial markets.
Comparison Table
| Feature | Alternative Data Signals | Technical Analysis Signals |
|---|---|---|
| Data Source | Non-traditional datasets (social media, satellite images, credit card transactions) | Price and volume data from trading charts |
| Signal Type | Fundamental and sentiment-driven insights | Trend, momentum, and pattern-based indicators |
| Time Horizon | Medium to long-term forecasting | Short to medium-term trading decisions |
| Complexity | High; requires advanced data processing and analytics | Moderate; based on established mathematical formulas |
| Accuracy | Potentially higher predictive power due to diverse data inputs | Relies on historic price patterns, may lag market changes |
| Implementation | Requires integration of big data platforms and machine learning | Typically implemented via charting software and indicators |
| Use Cases | Alpha generation, risk management, market sentiment analysis | Entry/exit timing, trend identification, volatility measurement |
Which is better?
Alternative data signals offer enhanced predictive power by incorporating non-traditional datasets such as social media trends, satellite imagery, and real-time consumer behavior, providing traders with unique insights beyond historical price patterns. Technical analysis signals rely on established chart patterns, moving averages, and momentum indicators to identify potential price movements based purely on market data. Combining alternative data with technical analysis often yields a more robust strategy, leveraging the strengths of both to improve trading accuracy and risk management.
Connection
Alternative data signals and technical analysis signals are interconnected through their shared focus on market behavior patterns and investor sentiment to predict price movements. Alternative data, such as social media trends, satellite imagery, and consumer transaction data, complements traditional technical indicators like moving averages and volume analysis by providing unique insights beyond price and volume. Integrating these diverse data sources enhances the accuracy of trading strategies by capturing both quantitative price action and qualitative market sentiment.
Key Terms
Technical analysis signals:
Technical analysis signals rely on historical price and volume data to predict future market movements by identifying patterns, trends, and momentum indicators such as moving averages, relative strength index (RSI), and MACD (Moving Average Convergence Divergence). These signals are widely used by traders for timing entry and exit points in various asset classes including stocks, forex, and cryptocurrencies. Explore the effectiveness and application of technical analysis signals in improving trading strategies.
Moving Average Crossover
Moving Average Crossover (MAC) is a widely used technical analysis signal that identifies trend shifts by comparing short-term and long-term moving averages. Unlike alternative data signals derived from unconventional sources like social media sentiment or satellite imagery, MAC relies purely on historical price data, providing clear buy or sell signals based on market momentum. Explore the strengths and limitations of both approaches to optimize your trading strategy.
Relative Strength Index (RSI)
Relative Strength Index (RSI) is a widely used technical analysis indicator that measures the speed and change of price movements to identify overbought or oversold conditions in a market. Alternative data signals, such as social media sentiment or satellite imagery, offer complementary insights that capture market behavior beyond traditional price and volume metrics. Explore how combining RSI with alternative data can enhance trading strategies and improve market predictions.
Source and External Links
Technical Analysis: Getting Started - Technical analysis uses price charts and patterns like bullish engulfing candles and indicators such as MACD and Bollinger Bands to generate buy and sell signals reflecting market psychology.
What Are Technical Indicators? | TrendSpider Learning Center - Technical indicators are mathematical calculations based on price and volume data, including popular signals like Moving Average Crossovers, MACD crossovers, Parabolic SAR dots, and volume-based indicators like On-Balance Volume, providing insights into trend strength and reversals.
Best Trading Indicators: Most Popular Technical Indicators / Axi - Key technical signals for traders include the RSI for momentum, MACD for trend changes, and moving averages for support/resistance, with interpretation often involving crossovers and divergence to identify potential entry or exit points.