Footprint charts provide detailed volume analysis by displaying bid and ask volumes at each price level, offering traders precise insights into market microstructure and order flow. Renko charts focus on price movement by filtering out time and volume, generating uniform bricks that highlight significant trends while reducing noise and false signals. Explore the strengths and strategies of footprint versus Renko charts to enhance your trading decisions.
Why it is important
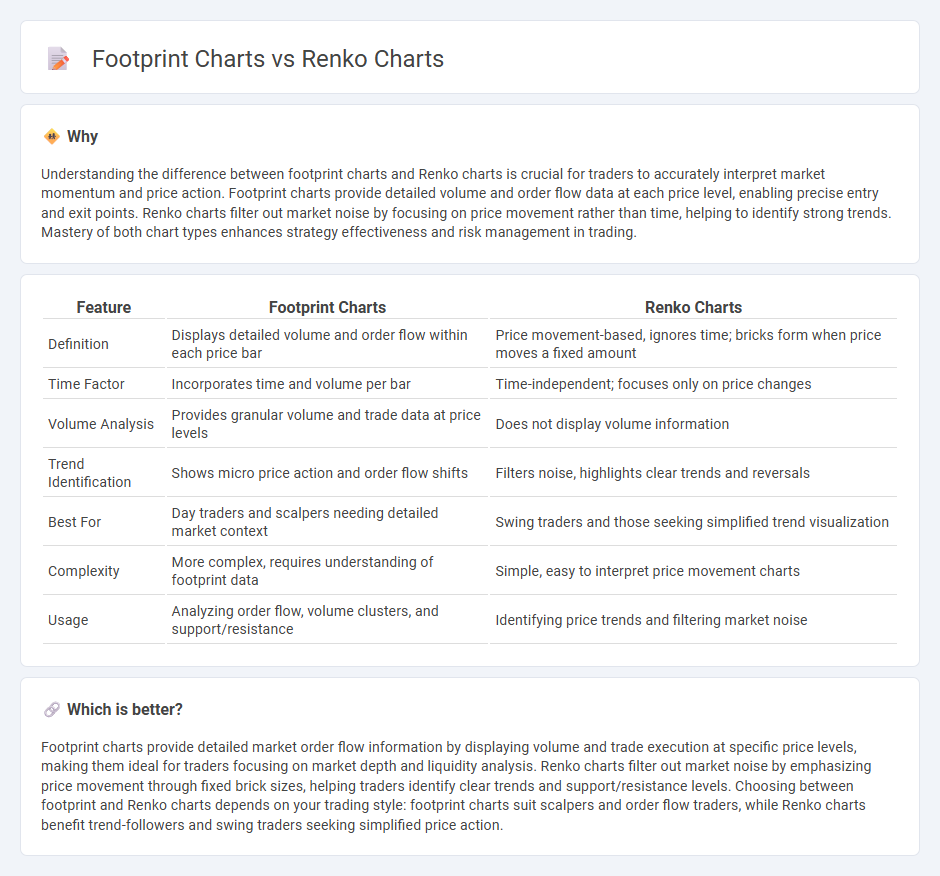
Understanding the difference between footprint charts and Renko charts is crucial for traders to accurately interpret market momentum and price action. Footprint charts provide detailed volume and order flow data at each price level, enabling precise entry and exit points. Renko charts filter out market noise by focusing on price movement rather than time, helping to identify strong trends. Mastery of both chart types enhances strategy effectiveness and risk management in trading.
Comparison Table
| Feature | Footprint Charts | Renko Charts |
|---|---|---|
| Definition | Displays detailed volume and order flow within each price bar | Price movement-based, ignores time; bricks form when price moves a fixed amount |
| Time Factor | Incorporates time and volume per bar | Time-independent; focuses only on price changes |
| Volume Analysis | Provides granular volume and trade data at price levels | Does not display volume information |
| Trend Identification | Shows micro price action and order flow shifts | Filters noise, highlights clear trends and reversals |
| Best For | Day traders and scalpers needing detailed market context | Swing traders and those seeking simplified trend visualization |
| Complexity | More complex, requires understanding of footprint data | Simple, easy to interpret price movement charts |
| Usage | Analyzing order flow, volume clusters, and support/resistance | Identifying price trends and filtering market noise |
Which is better?
Footprint charts provide detailed market order flow information by displaying volume and trade execution at specific price levels, making them ideal for traders focusing on market depth and liquidity analysis. Renko charts filter out market noise by emphasizing price movement through fixed brick sizes, helping traders identify clear trends and support/resistance levels. Choosing between footprint and Renko charts depends on your trading style: footprint charts suit scalpers and order flow traders, while Renko charts benefit trend-followers and swing traders seeking simplified price action.
Connection
Footprint charts and Renko charts both enhance trading analysis by emphasizing price action and market sentiment. Footprint charts display detailed volume data at each price level, revealing buying and selling pressure, while Renko charts filter out market noise by focusing on price movement with fixed brick sizes, highlighting trends. Traders combine these charts to gain precise entry and exit points, leveraging volume insights from footprint charts alongside Renko's clear trend visualization for improved decision-making.
Key Terms
Price action
Renko charts filter out market noise by using fixed price movement blocks, emphasizing pure price action without time influence, which helps traders identify clear trends and reversals. Footprint charts provide detailed transactional data within each price bar, showing volume, bid-ask activity, and order flow to reveal underlying market sentiment and liquidity dynamics. Explore how integrating Renko and footprint charts can enhance your price action trading strategies.
Volume analysis
Renko charts simplify price action by filtering out minor fluctuations, highlighting significant price trends through uniform brick sizes, whereas footprint charts offer detailed volume analysis by displaying order flow data at each price level. Footprint charts provide granular insights into buying and selling pressure, revealing market sentiment and potential reversals more precisely than Renko charts. Explore further to understand how each chart type enhances volume-based trading strategies.
Chart construction
Renko charts construct price movements by creating bricks of fixed size based on price changes, filtering out smaller fluctuations to emphasize trends. Footprint charts display detailed order flow by showing volume, bid-ask data, and traded prices within each price bar, providing granular market depth insights. Explore the differences in chart construction for a clearer understanding of their trading applications.
Source and External Links
Renko chart - A financial chart of Japanese origin used in technical analysis that plots price changes using fixed-size bricks, filtering out noise and showing trends clearly without regard to time intervals.
Tips for using Renko charts in your trading - Renko charts form bricks only when price moves a specified brick size, showing trends more clearly by ignoring time and small fluctuations, with new bricks colored by direction and plotted at a 45-degree angle.
Renko Charts: How do They Work in Trading? - Renko charts display price movements as bricks that move up or down at a 45-degree angle to highlight larger trends, with brick size set by the user determining when new bricks are formed.