Options flow reveals real-time market sentiment by tracking large or unusual options trades, offering insights into investor expectations and potential price movements. Price action focuses on analyzing historical price patterns, candlestick formations, and volume to predict future trends without relying on external indicators. Explore the strengths and limitations of both approaches to enhance your trading strategies.
Why it is important
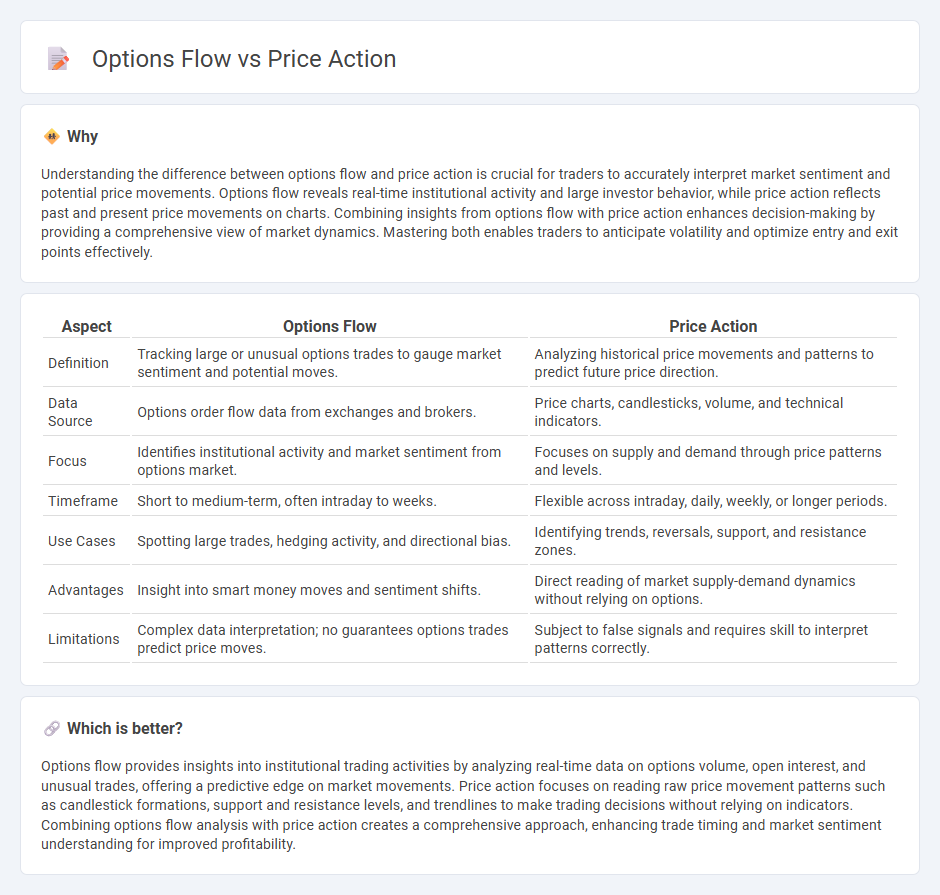
Understanding the difference between options flow and price action is crucial for traders to accurately interpret market sentiment and potential price movements. Options flow reveals real-time institutional activity and large investor behavior, while price action reflects past and present price movements on charts. Combining insights from options flow with price action enhances decision-making by providing a comprehensive view of market dynamics. Mastering both enables traders to anticipate volatility and optimize entry and exit points effectively.
Comparison Table
| Aspect | Options Flow | Price Action |
|---|---|---|
| Definition | Tracking large or unusual options trades to gauge market sentiment and potential moves. | Analyzing historical price movements and patterns to predict future price direction. |
| Data Source | Options order flow data from exchanges and brokers. | Price charts, candlesticks, volume, and technical indicators. |
| Focus | Identifies institutional activity and market sentiment from options market. | Focuses on supply and demand through price patterns and levels. |
| Timeframe | Short to medium-term, often intraday to weeks. | Flexible across intraday, daily, weekly, or longer periods. |
| Use Cases | Spotting large trades, hedging activity, and directional bias. | Identifying trends, reversals, support, and resistance zones. |
| Advantages | Insight into smart money moves and sentiment shifts. | Direct reading of market supply-demand dynamics without relying on options. |
| Limitations | Complex data interpretation; no guarantees options trades predict price moves. | Subject to false signals and requires skill to interpret patterns correctly. |
Which is better?
Options flow provides insights into institutional trading activities by analyzing real-time data on options volume, open interest, and unusual trades, offering a predictive edge on market movements. Price action focuses on reading raw price movement patterns such as candlestick formations, support and resistance levels, and trendlines to make trading decisions without relying on indicators. Combining options flow analysis with price action creates a comprehensive approach, enhancing trade timing and market sentiment understanding for improved profitability.
Connection
Options flow provides critical insights into market sentiment by revealing the volume and type of options contracts traders are buying or selling, directly influencing price action through anticipated supply and demand shifts. High call option activity often signals bullish expectations, potentially driving underlying asset prices higher, while increased put option flow suggests bearish sentiment, applying downward pressure on prices. Analyzing options flow alongside real-time price action enables traders to forecast short-term market movements and adjust strategies accordingly.
Key Terms
Candlestick Patterns
Candlestick patterns provide visual insights into price action by highlighting market sentiment and potential reversals through open, high, low, and close prices, offering traders a direct interpretation of supply and demand dynamics. In contrast, options flow tracks real-time buying and selling of option contracts, revealing institutional trader intentions and market sentiment shifts before they reflect in underlying price movements. Explore how combining candlestick patterns with options flow data enhances predictive accuracy and strategic trading decisions.
Open Interest
Open Interest in options flow provides real-time insight into market sentiment by showing the total number of outstanding contracts, which can reveal potential price movements not immediately visible through price action alone. While price action reflects historical price changes and patterns, analyzing changes in Open Interest helps traders identify emerging trends, support and resistance levels, and the strength behind price moves. Explore how integrating Open Interest with price action analysis can enhance your trading strategy.
Support and Resistance
Price action analysis identifies support and resistance levels by observing historical price movements and candlestick patterns, revealing areas where buying or selling pressures historically shift. Options flow data complements this by highlighting large option trades at specific strike prices, signaling potential market sentiment and validating key support and resistance zones. Explore deeper insights into how integrating price action with options flow can enhance trading strategies and decision-making.
Source and External Links
What is Price Action? (2025) A Complete Trader's Guide - Price action is the study of raw price movements over time, offering traders real-time insights into market sentiment, supply and demand, and potential future price direction by analyzing candlestick patterns, trends, and key support and resistance levels.
What Is Price Action? - Price Action Trading Introduction - Price action trading is a form of technical analysis focusing solely on the market's price history and movement over time, disregarding fundamental factors and derived indicators, to predict future price directions.
Price Action Trading Explained - Learn To Trade The Market - Price Action Trading is the method of making trading decisions from a "naked" price chart without relying on lagging indicators, based entirely on the belief that all fundamentals and news are already reflected in price movements.
 dowidth.com