High-frequency tick charts capture every trade executed, offering precise, real-time pricing data ideal for scalpers and day traders seeking granular market insights. Point and figure charts filter out minor price fluctuations by focusing solely on significant price movements, helping traders identify clear trends and support-resistance levels without time-based noise. Explore how these charting techniques can enhance your trading strategies and decision-making process.
Why it is important
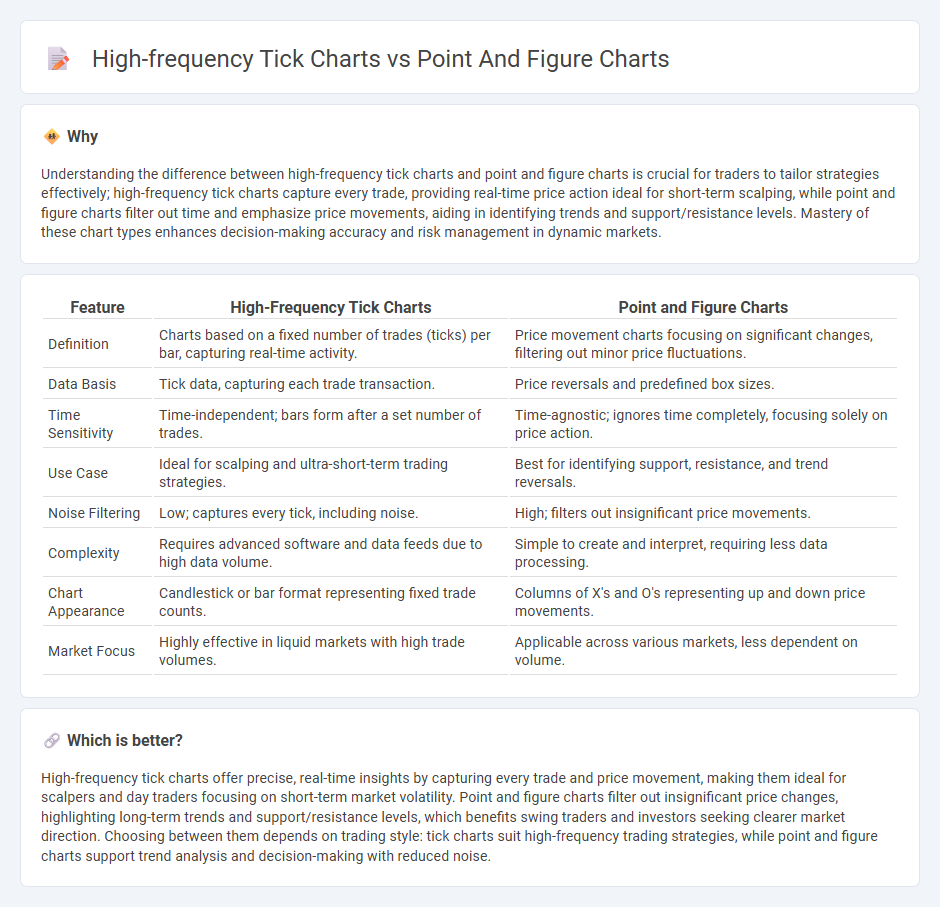
Understanding the difference between high-frequency tick charts and point and figure charts is crucial for traders to tailor strategies effectively; high-frequency tick charts capture every trade, providing real-time price action ideal for short-term scalping, while point and figure charts filter out time and emphasize price movements, aiding in identifying trends and support/resistance levels. Mastery of these chart types enhances decision-making accuracy and risk management in dynamic markets.
Comparison Table
| Feature | High-Frequency Tick Charts | Point and Figure Charts |
|---|---|---|
| Definition | Charts based on a fixed number of trades (ticks) per bar, capturing real-time activity. | Price movement charts focusing on significant changes, filtering out minor price fluctuations. |
| Data Basis | Tick data, capturing each trade transaction. | Price reversals and predefined box sizes. |
| Time Sensitivity | Time-independent; bars form after a set number of trades. | Time-agnostic; ignores time completely, focusing solely on price action. |
| Use Case | Ideal for scalping and ultra-short-term trading strategies. | Best for identifying support, resistance, and trend reversals. |
| Noise Filtering | Low; captures every tick, including noise. | High; filters out insignificant price movements. |
| Complexity | Requires advanced software and data feeds due to high data volume. | Simple to create and interpret, requiring less data processing. |
| Chart Appearance | Candlestick or bar format representing fixed trade counts. | Columns of X's and O's representing up and down price movements. |
| Market Focus | Highly effective in liquid markets with high trade volumes. | Applicable across various markets, less dependent on volume. |
Which is better?
High-frequency tick charts offer precise, real-time insights by capturing every trade and price movement, making them ideal for scalpers and day traders focusing on short-term market volatility. Point and figure charts filter out insignificant price changes, highlighting long-term trends and support/resistance levels, which benefits swing traders and investors seeking clearer market direction. Choosing between them depends on trading style: tick charts suit high-frequency trading strategies, while point and figure charts support trend analysis and decision-making with reduced noise.
Connection
High-frequency tick charts capture market activity with ultra-low latency by plotting every trade or fixed number of trades, enabling traders to detect micro price movements and execute rapid strategies. Point and figure charts abstract price action by filtering out time and volume, focusing solely on significant price reversals and trends, providing a clearer view of supply and demand dynamics. Integrating insights from high-frequency tick charts with the trend clarity of point and figure charts enhances precision in timing entries and exits in fast-paced trading environments.
Key Terms
Price Action
Point and figure charts emphasize price action by filtering out time and volume, focusing exclusively on significant price movements and trend reversals, making them ideal for identifying support and resistance levels. High-frequency tick charts capture every trade at ultra-short intervals, offering granular insights into price momentum and microstructure dynamics crucial for active traders. Explore the nuances and practical applications of both chart types to enhance your price action analysis strategies.
Time Independence
Point and figure charts emphasize price movement without regard to time, filtering out insignificant fluctuations by plotting only significant price reversals, which enhances trend clarity and reduces noise. High-frequency tick charts capture each transaction in real time, providing detailed intra-trade data that reflects market dynamics and order flow with precise time stamps. Explore the differences in time independence and their impact on trading strategies to optimize your market analysis.
Trade Frequency
Point and figure charts emphasize price movements and filter out insignificant fluctuations, resulting in fewer but more meaningful trade signals compared to high-frequency tick charts, which capture every tick and generate a significantly higher trade frequency. High-frequency tick charts can lead to noise and overtrading due to their sensitivity to each individual trade, whereas point and figure charts help traders focus on significant trends by aggregating price action. Explore a detailed comparison of trade frequency and strategy implications between these charting methods.
Source and External Links
Point and figure chart - Wikipedia - Point and figure charts are a technical analysis tool that plots price movements without regard to time, using columns of X's and O's to represent rising and falling prices, filtering out small price changes and emphasizing trend direction and support/resistance levels.
What are point and figure charts - TradingView - Point and figure charts focus solely on price movement, excluding time and noise, using customizable box sizes and reversal amounts to identify trends, breakouts, and key support/resistance, often featuring natural diagonal trend lines aiding market direction analysis.
Point and Figure Charting Guide - Incredible Charts - Point and figure charts summarize price trends by filtering out short-term market noise, highlight major support and resistance levels, and can be used effectively with other indicators for pattern identification and trend analysis.