High-frequency tick charts capture every trade executed in the market, providing traders with granular insights into price movements based on transaction volume rather than time intervals. Order flow charts visualize the real-time buying and selling pressure by displaying the actual orders hitting the market, enabling traders to understand supply and demand dynamics more precisely. Explore how mastering high-frequency tick charts and order flow charts can enhance your trading strategies and decision-making.
Why it is important
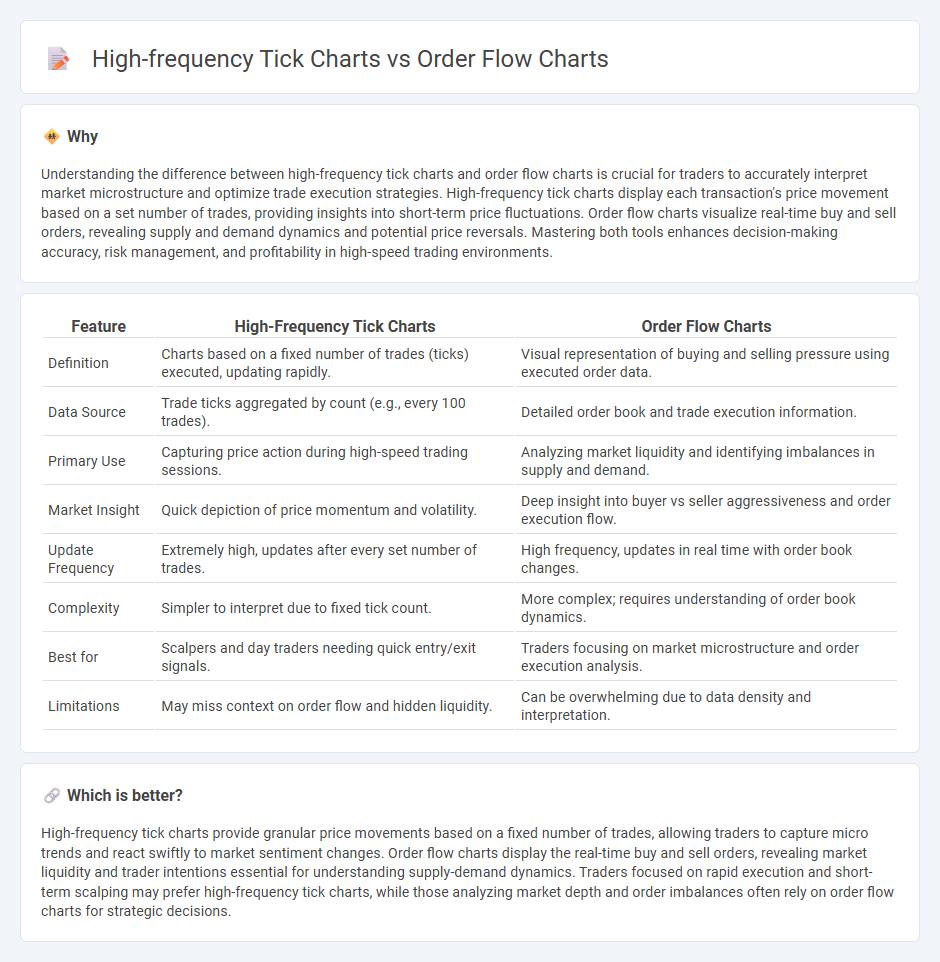
Understanding the difference between high-frequency tick charts and order flow charts is crucial for traders to accurately interpret market microstructure and optimize trade execution strategies. High-frequency tick charts display each transaction's price movement based on a set number of trades, providing insights into short-term price fluctuations. Order flow charts visualize real-time buy and sell orders, revealing supply and demand dynamics and potential price reversals. Mastering both tools enhances decision-making accuracy, risk management, and profitability in high-speed trading environments.
Comparison Table
| Feature | High-Frequency Tick Charts | Order Flow Charts |
|---|---|---|
| Definition | Charts based on a fixed number of trades (ticks) executed, updating rapidly. | Visual representation of buying and selling pressure using executed order data. |
| Data Source | Trade ticks aggregated by count (e.g., every 100 trades). | Detailed order book and trade execution information. |
| Primary Use | Capturing price action during high-speed trading sessions. | Analyzing market liquidity and identifying imbalances in supply and demand. |
| Market Insight | Quick depiction of price momentum and volatility. | Deep insight into buyer vs seller aggressiveness and order execution flow. |
| Update Frequency | Extremely high, updates after every set number of trades. | High frequency, updates in real time with order book changes. |
| Complexity | Simpler to interpret due to fixed tick count. | More complex; requires understanding of order book dynamics. |
| Best for | Scalpers and day traders needing quick entry/exit signals. | Traders focusing on market microstructure and order execution analysis. |
| Limitations | May miss context on order flow and hidden liquidity. | Can be overwhelming due to data density and interpretation. |
Which is better?
High-frequency tick charts provide granular price movements based on a fixed number of trades, allowing traders to capture micro trends and react swiftly to market sentiment changes. Order flow charts display the real-time buy and sell orders, revealing market liquidity and trader intentions essential for understanding supply-demand dynamics. Traders focused on rapid execution and short-term scalping may prefer high-frequency tick charts, while those analyzing market depth and order imbalances often rely on order flow charts for strategic decisions.
Connection
High-frequency tick charts display price movements at each individual trade, providing granular temporal resolution that captures market microstructure dynamics. Order flow charts complement this by visualizing the volume and aggressiveness of buy and sell orders, revealing the underlying supply and demand pressures influencing price changes. Integrating these tools allows traders to analyze the precise sequence of trades alongside real-time order imbalances, enhancing decision-making in high-frequency trading strategies.
Key Terms
Liquidity
Order flow charts provide detailed insights into market liquidity by visualizing buy and sell orders at various price levels, highlighting the actual demand and supply dynamics. High-frequency tick charts capture price movements at extremely granular intervals, offering a precise view of market activity but often lacking direct liquidity context. Explore how both chart types can enhance your understanding of liquidity in active trading environments.
Trade Execution Speed
Order flow charts provide granular insight into market liquidity by displaying bid and ask volumes, enabling traders to anticipate price movements with precise trade execution speed. High-frequency tick charts aggregate numerous trades into rapid time intervals, offering a real-time perspective optimized for ultra-fast order placement and scalping strategies. Explore how these charting methods enhance your trade execution efficiency and decision-making in high-speed markets.
Market Depth
Order flow charts provide a detailed view of market transactions by tracking executed trade data and price movements, offering insights into buyer and seller aggression within the order book. High-frequency tick charts capture rapid tick-by-tick price changes, emphasizing short-term volatility but often lack the granularity of order book depth. Explore the nuances of Market Depth analysis to enhance your trading strategy by understanding the strengths of each chart type.
Source and External Links
Order Flow Trading for TVC:GOLD by samstoobad - TradingView - Order flow trading analyzes real-time buy and sell order flows in the market to understand liquidity, identify major participants, and anticipate price moves by looking beyond historical data to actual transaction flows.
Order Flow Trading & Volumetric Bars | NinjaTrader - NinjaTrader offers tools like volumetric bars, order flow volume profiles, VWAP, and cumulative delta to visualize and analyze order flow in real-time, helping traders identify buying/selling pressure and key price levels.
How Bookmap Order Flow Provides Stock Traders With An Edge? - Bookmap uniquely visualizes order flow with a heatmap that displays limit order accumulation and liquidity, allowing traders to see market depth and real-time order book changes at nanosecond precision for enhanced market insight.