Volume profile reading reveals key price levels by analyzing trading activity and volume distribution over time, highlighting areas of support and resistance. Moving averages smooth price data to identify trends and potential reversals by calculating average prices over specific periods. Discover how combining these tools can enhance your trading strategy and improve market timing.
Why it is important
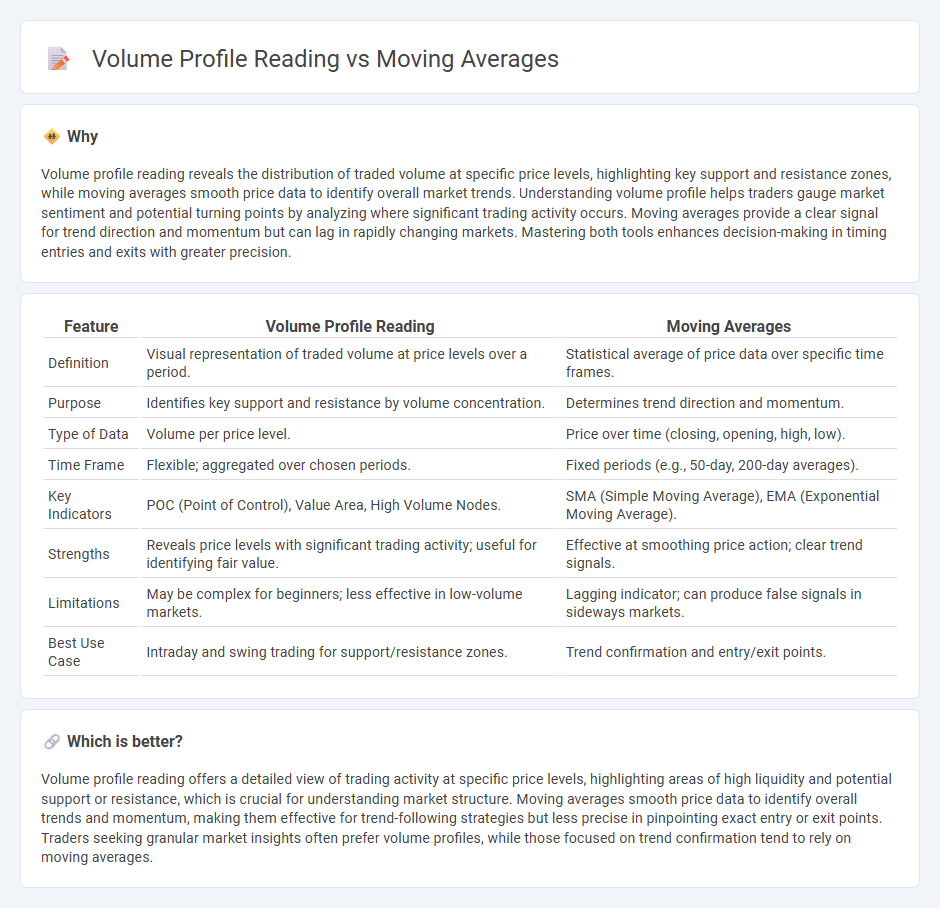
Volume profile reading reveals the distribution of traded volume at specific price levels, highlighting key support and resistance zones, while moving averages smooth price data to identify overall market trends. Understanding volume profile helps traders gauge market sentiment and potential turning points by analyzing where significant trading activity occurs. Moving averages provide a clear signal for trend direction and momentum but can lag in rapidly changing markets. Mastering both tools enhances decision-making in timing entries and exits with greater precision.
Comparison Table
| Feature | Volume Profile Reading | Moving Averages |
|---|---|---|
| Definition | Visual representation of traded volume at price levels over a period. | Statistical average of price data over specific time frames. |
| Purpose | Identifies key support and resistance by volume concentration. | Determines trend direction and momentum. |
| Type of Data | Volume per price level. | Price over time (closing, opening, high, low). |
| Time Frame | Flexible; aggregated over chosen periods. | Fixed periods (e.g., 50-day, 200-day averages). |
| Key Indicators | POC (Point of Control), Value Area, High Volume Nodes. | SMA (Simple Moving Average), EMA (Exponential Moving Average). |
| Strengths | Reveals price levels with significant trading activity; useful for identifying fair value. | Effective at smoothing price action; clear trend signals. |
| Limitations | May be complex for beginners; less effective in low-volume markets. | Lagging indicator; can produce false signals in sideways markets. |
| Best Use Case | Intraday and swing trading for support/resistance zones. | Trend confirmation and entry/exit points. |
Which is better?
Volume profile reading offers a detailed view of trading activity at specific price levels, highlighting areas of high liquidity and potential support or resistance, which is crucial for understanding market structure. Moving averages smooth price data to identify overall trends and momentum, making them effective for trend-following strategies but less precise in pinpointing exact entry or exit points. Traders seeking granular market insights often prefer volume profiles, while those focused on trend confirmation tend to rely on moving averages.
Connection
Volume profile reading reveals the distribution of traded volume at specific price levels, highlighting key support and resistance zones where market participants show interest. Moving averages smooth price data to identify trends and dynamic support or resistance, providing context to volume profile insights. Together, they enhance trading strategies by combining volume-based market structure analysis with trend direction and momentum assessment.
Key Terms
Trend Identification
Moving averages smooth price data to highlight prevailing trends by averaging past prices over specific periods, aiding in trend direction and momentum analysis. Volume profile reading charts the volume traded at each price level, revealing key support and resistance zones that align with price movement strength and trader interest. Explore further to understand how combining these tools enhances accurate trend identification.
Support/Resistance Levels
Moving averages smooth price data to identify dynamic support and resistance levels based on historical price trends, while volume profile reveals price levels with high trading activity, highlighting key static support and resistance zones. Volume profile reading offers precise insight into market sentiment by pinpointing areas where large volumes establish strong price acceptance or rejection. Explore comprehensive strategies combining moving averages and volume profile for effective support and resistance analysis.
Price-Volume Relationship
Moving averages smooth out price data to identify trend directions, while volume profile reading maps trading activity at specific price levels to reveal market interest and support-resistance zones. Understanding the price-volume relationship helps traders confirm trend strength by correlating price movements with volume intensity captured through volume profiles. Explore more to master how integrating moving averages with volume profiles can enhance trading accuracy and market analysis.
Source and External Links
How to Use Moving Averages (MA) | Learn to Trade | OANDA | US - Moving averages are lagging indicators that smooth price data over time to confirm market trends, with common types including Simple Moving Average (SMA), Exponential Moving Average (EMA), and Volume Weighted Moving Average (VWMA), each serving to highlight price trends and potential reversals with varying sensitivity.
Moving average - Wikipedia - A moving average is a statistical tool used to analyze time series data by averaging subsets of data points to smooth out short-term fluctuations and highlight longer-term trends or cycles in economic or signal processing contexts.
Moving Average: What it is and How to Calculate it - Statistics How To - Moving averages are calculated by averaging data subsets repeatedly to help visualize and forecast long-term trends in data sets, commonly used in stock market analysis with periods such as 50-day or 200-day moving averages.