Footprint charts reveal detailed order flow by displaying transaction volume at each price level, enabling traders to analyze buying and selling pressure in real time. Market Profile organizes price distribution over time by plotting volume or time spent at each price, highlighting key support and resistance zones through value areas and price acceptance levels. Explore how these powerful tools can enhance your market analysis and trading decisions.
Why it is important
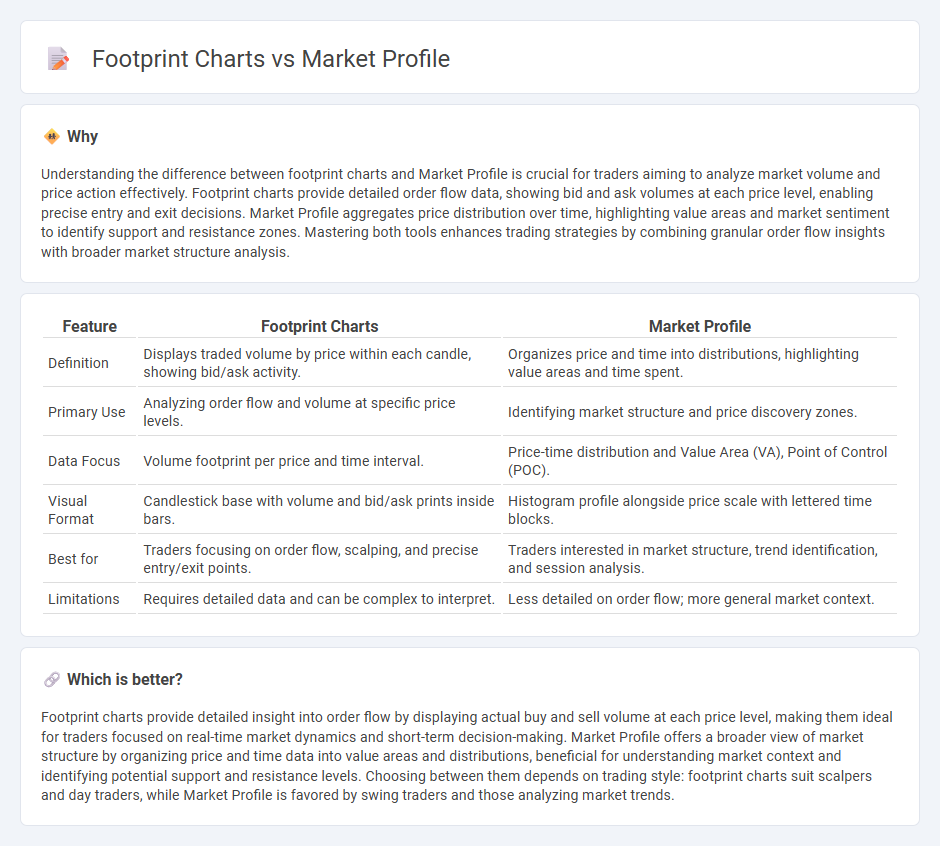
Understanding the difference between footprint charts and Market Profile is crucial for traders aiming to analyze market volume and price action effectively. Footprint charts provide detailed order flow data, showing bid and ask volumes at each price level, enabling precise entry and exit decisions. Market Profile aggregates price distribution over time, highlighting value areas and market sentiment to identify support and resistance zones. Mastering both tools enhances trading strategies by combining granular order flow insights with broader market structure analysis.
Comparison Table
| Feature | Footprint Charts | Market Profile |
|---|---|---|
| Definition | Displays traded volume by price within each candle, showing bid/ask activity. | Organizes price and time into distributions, highlighting value areas and time spent. |
| Primary Use | Analyzing order flow and volume at specific price levels. | Identifying market structure and price discovery zones. |
| Data Focus | Volume footprint per price and time interval. | Price-time distribution and Value Area (VA), Point of Control (POC). |
| Visual Format | Candlestick base with volume and bid/ask prints inside bars. | Histogram profile alongside price scale with lettered time blocks. |
| Best for | Traders focusing on order flow, scalping, and precise entry/exit points. | Traders interested in market structure, trend identification, and session analysis. |
| Limitations | Requires detailed data and can be complex to interpret. | Less detailed on order flow; more general market context. |
Which is better?
Footprint charts provide detailed insight into order flow by displaying actual buy and sell volume at each price level, making them ideal for traders focused on real-time market dynamics and short-term decision-making. Market Profile offers a broader view of market structure by organizing price and time data into value areas and distributions, beneficial for understanding market context and identifying potential support and resistance levels. Choosing between them depends on trading style: footprint charts suit scalpers and day traders, while Market Profile is favored by swing traders and those analyzing market trends.
Connection
Footprint charts and Market Profile both provide detailed insights into market activity by analyzing volume distribution at specific price levels, enhancing traders' ability to identify support and resistance zones. Footprint charts display real-time order flow with bid-ask volume breakdowns, while Market Profile organizes price data over time into a bell curve, showing areas of high trading activity or value areas. Together, these tools offer a comprehensive view of market structure, combining volume analysis with time-based price acceptance to improve trade entry and exit decisions.
Key Terms
Volume Distribution
Market Profile charts organize price data into time-based distributions, revealing value areas, initial balance, and market sentiment through a bell-curve shape. Footprint charts provide granular insight by displaying volume traded at each price level within a specific time, highlighting buying and selling imbalances. Explore the nuances of Volume Distribution with Market Profile and Footprint charts to enhance trading precision and market analysis.
Price Auction
Market Profile and footprint charts both provide detailed insights into Price Auction dynamics, capturing the distribution of traded volume at specific price levels. Market Profile arranges data into time-based price brackets, revealing market value areas and auction imbalances, while footprint charts offer a granular view of volume and order flow within each price bar. Explore our advanced resources to deepen your understanding of Price Auction interpretation using these powerful tools.
Order Flow
Market Profile charts visualize price distribution over time, highlighting value areas and price acceptance levels, while footprint charts offer detailed order flow information by displaying bid and ask volume at each price level. Footprint charts enable traders to analyze market sentiment and identify buying or selling pressure with precise volume data, enhancing decision-making in active trading environments. Explore how mastering order flow through these tools can improve trading accuracy and strategy development.
Source and External Links
What is the Market Profile? - Jim Dalton Trading - The Market Profile is a unique charting tool that displays the two-way auction process driving market movement by organizing price, time, and volume data into a graphical bell curve format, allowing traders to observe patterns in market behavior over time.
What Is Market Profile? - NinjaTrader - Market Profile is a dynamic charting method showing the volume of transactions at each price level to help traders understand supply and demand interactions and overall market sentiment.
Market Profile Trading: Understanding its Power and Impact - Market Profile trading provides insights into market structure, price distribution, and trading activity over time by visually organizing price and volume data, helping traders identify areas of strong demand and potential trading levels.