Volume profile reading reveals the distribution of trading activity at specific price levels, highlighting key support and resistance zones based on order flow strength. Footprint charts provide granular insight into market microstructure by showing real-time bid and ask volume, enabling traders to identify aggressive buying or selling within each price bar. Explore the differences between these tools to enhance your trading strategy and market analysis.
Why it is important
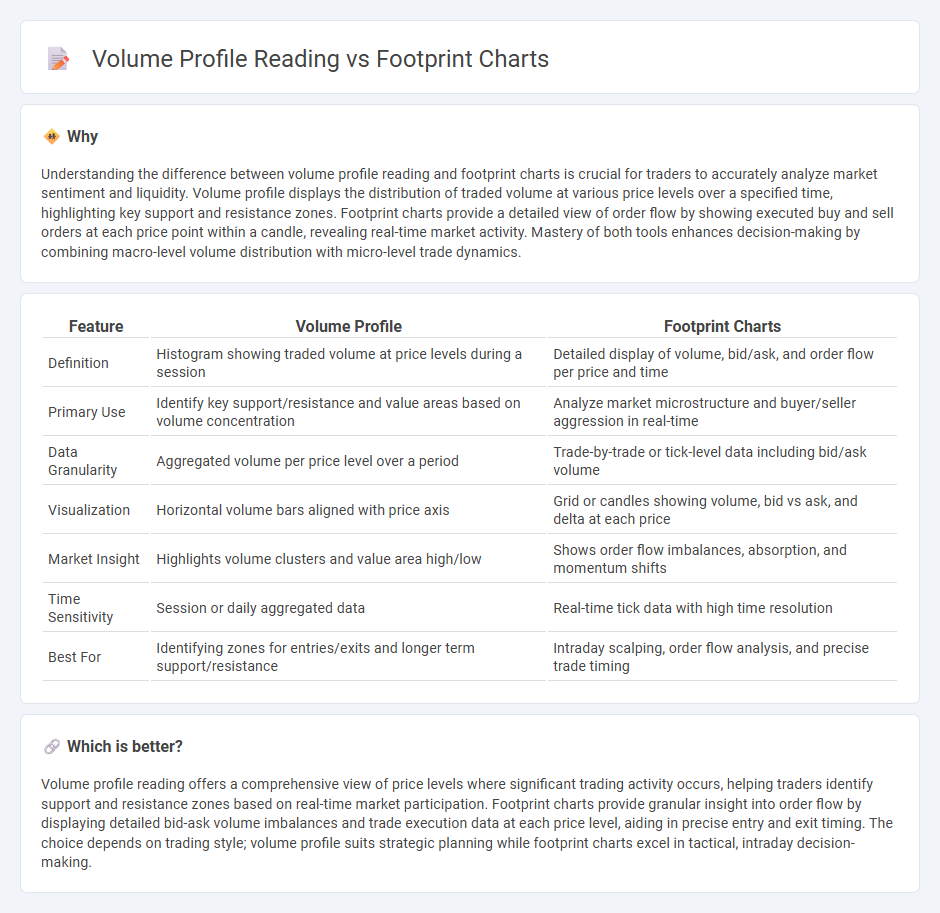
Understanding the difference between volume profile reading and footprint charts is crucial for traders to accurately analyze market sentiment and liquidity. Volume profile displays the distribution of traded volume at various price levels over a specified time, highlighting key support and resistance zones. Footprint charts provide a detailed view of order flow by showing executed buy and sell orders at each price point within a candle, revealing real-time market activity. Mastery of both tools enhances decision-making by combining macro-level volume distribution with micro-level trade dynamics.
Comparison Table
| Feature | Volume Profile | Footprint Charts |
|---|---|---|
| Definition | Histogram showing traded volume at price levels during a session | Detailed display of volume, bid/ask, and order flow per price and time |
| Primary Use | Identify key support/resistance and value areas based on volume concentration | Analyze market microstructure and buyer/seller aggression in real-time |
| Data Granularity | Aggregated volume per price level over a period | Trade-by-trade or tick-level data including bid/ask volume |
| Visualization | Horizontal volume bars aligned with price axis | Grid or candles showing volume, bid vs ask, and delta at each price |
| Market Insight | Highlights volume clusters and value area high/low | Shows order flow imbalances, absorption, and momentum shifts |
| Time Sensitivity | Session or daily aggregated data | Real-time tick data with high time resolution |
| Best For | Identifying zones for entries/exits and longer term support/resistance | Intraday scalping, order flow analysis, and precise trade timing |
Which is better?
Volume profile reading offers a comprehensive view of price levels where significant trading activity occurs, helping traders identify support and resistance zones based on real-time market participation. Footprint charts provide granular insight into order flow by displaying detailed bid-ask volume imbalances and trade execution data at each price level, aiding in precise entry and exit timing. The choice depends on trading style; volume profile suits strategic planning while footprint charts excel in tactical, intraday decision-making.
Connection
Volume profile reading and footprint charts are interconnected tools that provide traders with detailed market structure insights by highlighting price levels with significant trading activity. Volume profiles display the distribution of traded volume over price levels, identifying areas of high liquidity and support or resistance zones. Footprint charts complement this by showing real-time order flow and execution details within those price levels, allowing traders to analyze buying and selling pressure more precisely.
Key Terms
Bid-Ask Imbalance
Footprint charts provide granular insight into bid-ask imbalances by displaying each executed trade at specific price levels, highlighting areas of buying or selling pressure in real-time. Volume profiles aggregate trading volume across price ranges, revealing high liquidity zones but offering less precision on bid-ask dynamics. Explore deeper analysis techniques to master bid-ask imbalance reading for enhanced trading decisions.
Delta
Footprint charts provide detailed tick-by-tick data showing individual trade prices and volumes, enabling precise Delta analysis by highlighting the difference between buying and selling pressure within each price bar. Volume profile reading aggregates traded volume across price levels, offering a broader view of market structure but less granularity in Delta measurement. Explore how mastering Delta through footprint charts can enhance your trading accuracy and decision-making strategies.
Source and External Links
Comparing Footprint & Volume Profile Trading - Footprint charts display a candle-like visual showing executed buy and sell volumes at each price level within a time interval, allowing detection of market imbalances by comparing buy and sell market orders at adjacent price levels.
Volume footprint charts: a complete guide - Volume footprint charts visualize buyer and seller volume distribution at multiple price levels per candle with detailed metrics like volume delta, Point of Control, and highlight significant liquidity areas using gradient colors.
Visualizing Market Order Flow The Footprint Chart Advantage - Footprint Charts provide detailed insights into market order flow by showing trades executed at the bid and ask prices with delta bars representing net buying or selling volume to reveal market sentiment at each price level within a chosen timeframe.