Order flow footprint charts visualize individual trades within each price level, providing granular insight into market buying and selling pressure. Depth of Market (DOM) displays aggregated bid and ask liquidity at various price points, revealing real-time supply and demand dynamics. Explore these tools further to enhance your trading strategy with precise market analysis.
Why it is important
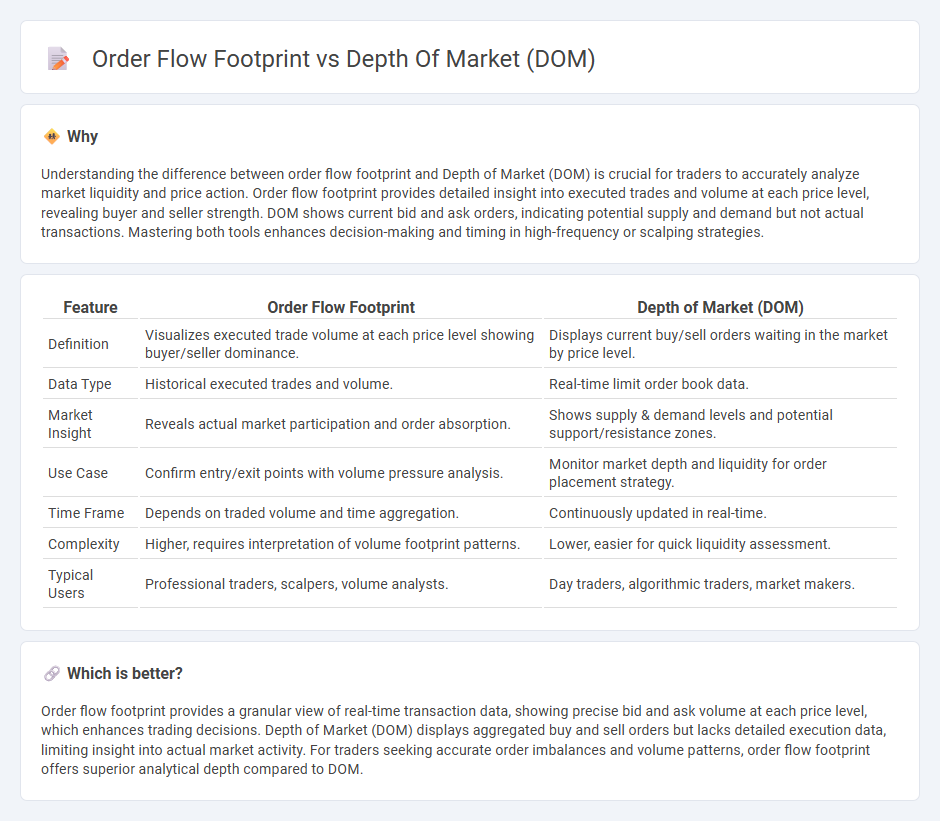
Understanding the difference between order flow footprint and Depth of Market (DOM) is crucial for traders to accurately analyze market liquidity and price action. Order flow footprint provides detailed insight into executed trades and volume at each price level, revealing buyer and seller strength. DOM shows current bid and ask orders, indicating potential supply and demand but not actual transactions. Mastering both tools enhances decision-making and timing in high-frequency or scalping strategies.
Comparison Table
| Feature | Order Flow Footprint | Depth of Market (DOM) |
|---|---|---|
| Definition | Visualizes executed trade volume at each price level showing buyer/seller dominance. | Displays current buy/sell orders waiting in the market by price level. |
| Data Type | Historical executed trades and volume. | Real-time limit order book data. |
| Market Insight | Reveals actual market participation and order absorption. | Shows supply & demand levels and potential support/resistance zones. |
| Use Case | Confirm entry/exit points with volume pressure analysis. | Monitor market depth and liquidity for order placement strategy. |
| Time Frame | Depends on traded volume and time aggregation. | Continuously updated in real-time. |
| Complexity | Higher, requires interpretation of volume footprint patterns. | Lower, easier for quick liquidity assessment. |
| Typical Users | Professional traders, scalpers, volume analysts. | Day traders, algorithmic traders, market makers. |
Which is better?
Order flow footprint provides a granular view of real-time transaction data, showing precise bid and ask volume at each price level, which enhances trading decisions. Depth of Market (DOM) displays aggregated buy and sell orders but lacks detailed execution data, limiting insight into actual market activity. For traders seeking accurate order imbalances and volume patterns, order flow footprint offers superior analytical depth compared to DOM.
Connection
Order flow footprint provides a detailed visualization of executed trades at specific price levels, revealing the market's actual buying and selling activity, while Depth of Market (DOM) displays current buy and sell orders pending at various price points. Together, these tools enable traders to analyze liquidity and market sentiment by comparing the real transaction data from order flow footprints against the potential volume reflected in DOM. This connection helps identify trade imbalances, support and resistance levels, and likely price movements for more informed trading decisions.
Key Terms
Liquidity
Depth of Market (DOM) displays real-time liquidity by showing the number of buy and sell orders at different price levels, offering a snapshot of market depth and potential support or resistance. Order flow footprint provides a granular view of executed trades, revealing precise liquidity consumption and aggressive buying or selling activity within each price bar. Explore these tools further to enhance your understanding of liquidity dynamics and improve trading decisions.
Bid-Ask Volume
Depth of Market (DOM) displays real-time bid and ask prices along with corresponding order sizes, providing traders with insight into market liquidity and price levels. Order flow footprint charts offer a detailed breakdown of bid-ask volume at each price point, enabling precise analysis of buyer and seller aggressiveness and market sentiment. Explore the differences to enhance your trading strategy and master order flow analysis.
Price Levels
Depth of Market (DOM) displays real-time buy and sell orders at various price levels, providing a snapshot of market liquidity and potential support or resistance zones. Order flow footprint charts reveal detailed trading activity by showing executed order volume at each price level, enabling traders to assess the strength behind price movements. Explore further to understand how combining DOM and order flow footprint enhances price level analysis and trading decisions.
Source and External Links
Depth of Market (DOM) - Overview, Application, Factors - Depth of Market (DOM), also known as the order book, is a real-time display of pending buy and sell orders at different price levels for a security or currency, indicating market liquidity and helping traders see supply and demand dynamics.
Depth of Market|DOM - DOM shows how many open buy and sell orders exist at various prices for a security, reflecting market liquidity and enabling traders to assess potential price movements based on order size and depth.
Depth of market (DOM): what it is and how traders can use it - DOM functions as a digital order book providing insights into the number of buy and sell orders at multiple price points, which traders use to understand supply and demand trends and market liquidity for better trading decisions.