Tape reading focuses on analyzing real-time transaction data and order flow to gauge market sentiment and momentum, offering immediate insights into price movements. Chart patterns rely on historical price data visualized over time to identify trends and potential reversals through recognizable formations like head and shoulders or flags. Explore deeper strategies to understand how combining tape reading and chart patterns can enhance your trading decisions.
Why it is important
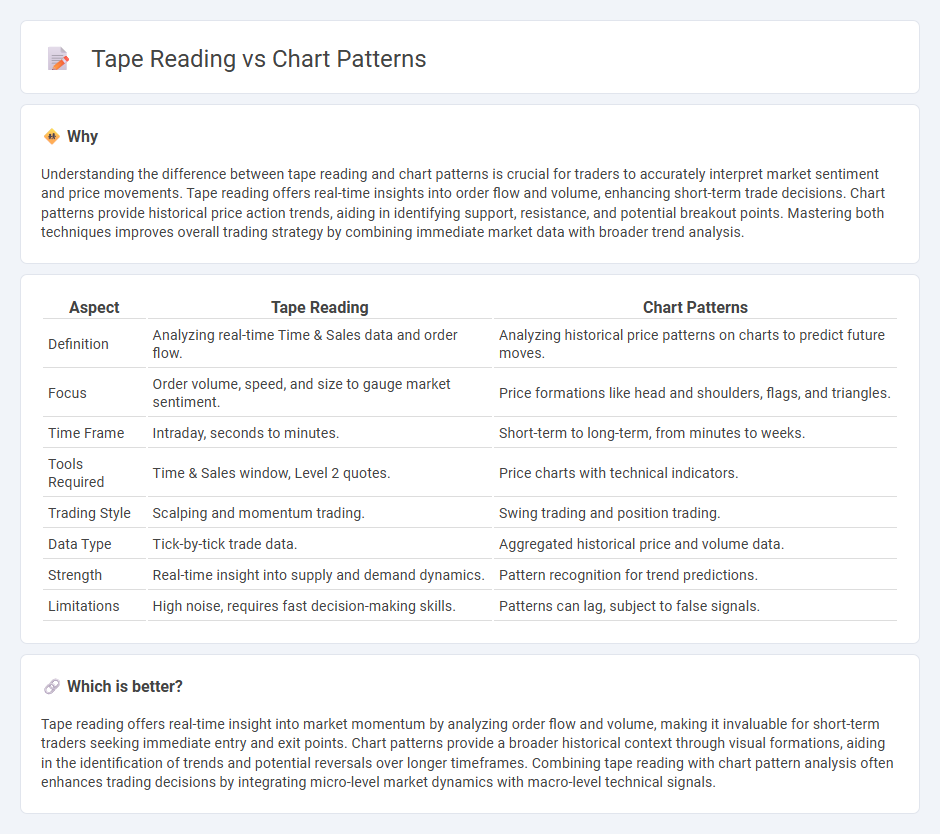
Understanding the difference between tape reading and chart patterns is crucial for traders to accurately interpret market sentiment and price movements. Tape reading offers real-time insights into order flow and volume, enhancing short-term trade decisions. Chart patterns provide historical price action trends, aiding in identifying support, resistance, and potential breakout points. Mastering both techniques improves overall trading strategy by combining immediate market data with broader trend analysis.
Comparison Table
| Aspect | Tape Reading | Chart Patterns |
|---|---|---|
| Definition | Analyzing real-time Time & Sales data and order flow. | Analyzing historical price patterns on charts to predict future moves. |
| Focus | Order volume, speed, and size to gauge market sentiment. | Price formations like head and shoulders, flags, and triangles. |
| Time Frame | Intraday, seconds to minutes. | Short-term to long-term, from minutes to weeks. |
| Tools Required | Time & Sales window, Level 2 quotes. | Price charts with technical indicators. |
| Trading Style | Scalping and momentum trading. | Swing trading and position trading. |
| Data Type | Tick-by-tick trade data. | Aggregated historical price and volume data. |
| Strength | Real-time insight into supply and demand dynamics. | Pattern recognition for trend predictions. |
| Limitations | High noise, requires fast decision-making skills. | Patterns can lag, subject to false signals. |
Which is better?
Tape reading offers real-time insight into market momentum by analyzing order flow and volume, making it invaluable for short-term traders seeking immediate entry and exit points. Chart patterns provide a broader historical context through visual formations, aiding in the identification of trends and potential reversals over longer timeframes. Combining tape reading with chart pattern analysis often enhances trading decisions by integrating micro-level market dynamics with macro-level technical signals.
Connection
Tape reading provides real-time order flow data that reveals buying and selling pressures, while chart patterns visualize historical price movements and trends identified from that data. Combining tape reading with chart pattern analysis enhances traders' ability to confirm market sentiment and predict short-term price reversals or breakouts. This integration improves decision-making accuracy by aligning micro-level volume dynamics with macro-level technical formations.
Key Terms
**Chart Patterns:**
Chart patterns analyze historical price movements to identify recurring formations such as head and shoulders, triangles, and double tops, which help predict future market direction. These patterns rely on technical analysis tools and volume indicators to confirm potential breakouts or reversals, enhancing trading decision accuracy. Explore more to understand how mastering chart patterns can improve your trading strategy.
Head and Shoulders
Head and Shoulders is a classic chart pattern used in technical analysis to predict trend reversals by identifying a peak (head) flanked by two lower peaks (shoulders) on price charts. Tape reading, on the other hand, analyzes real-time order flow and volume to confirm the strength or weakness behind the Head and Shoulders formation by observing market participant behavior. Explore deeper insights into combining Head and Shoulders with tape reading techniques for enhanced trading precision.
Double Top/Bottom
Double Top and Double Bottom chart patterns signal potential trend reversals by identifying key resistance and support levels through price peaks and troughs. Tape reading enhances these patterns by analyzing real-time order flow, volume spikes, and market sentiment to validate the strength of the reversal signal. Explore deeper insights on combining chart patterns and tape reading for more precise trading decisions.
Source and External Links
Chart pattern - Chart patterns are recurring price formations on a chart used in technical analysis to predict market movements, categorized mainly into reversal and continuation patterns such as Double Top, Head and Shoulders, Triangles, and Harmonic patterns like Bat and Gartley, which use Fibonacci ratios to identify probable reversal zones.
42 Chart Patterns for Effective Intraday, Swing & F&O Trading - Strike - This resource provides a wide overview of 42 technical chart patterns including candlestick patterns like Engulfing, Hammer, Doji, and Morning/Evening Stars, which help traders assess market psychology and potential trend reversals or continuations based on candle shapes and formations.
11 Trading Chart Patterns You Should Know - FOREX.com US - Discusses common chart patterns such as ascending/descending staircases, triangles, flags, wedges, double tops/bottoms, head and shoulders, and cup and handle, explaining their significance as continuation, reversal, or bilateral signals for trend identification and trading strategies.