Volume profile reading reveals the distribution of traded volume across price levels, highlighting areas of support and resistance that influence market behavior. Candlestick patterns provide visual insights into price movements within specific time frames, illustrating buyer and seller sentiment through formations like dojis or engulfings. Explore the nuanced advantages of volume profile reading compared to candlestick patterns to enhance your trading strategy.
Why it is important
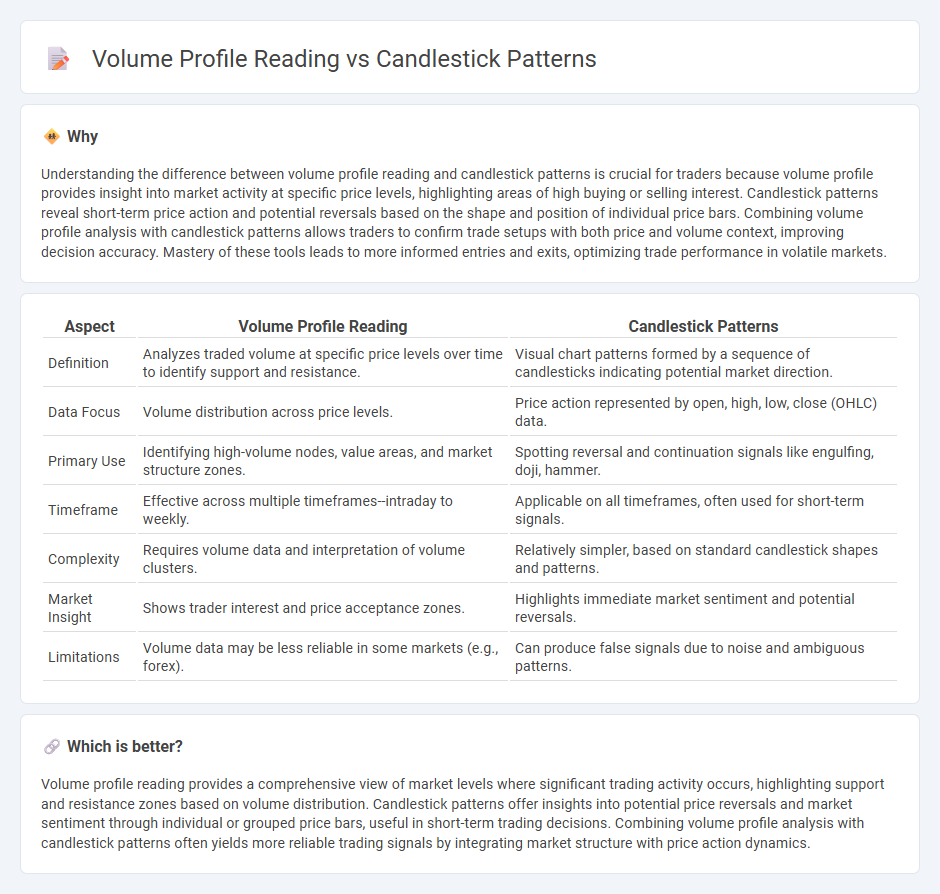
Understanding the difference between volume profile reading and candlestick patterns is crucial for traders because volume profile provides insight into market activity at specific price levels, highlighting areas of high buying or selling interest. Candlestick patterns reveal short-term price action and potential reversals based on the shape and position of individual price bars. Combining volume profile analysis with candlestick patterns allows traders to confirm trade setups with both price and volume context, improving decision accuracy. Mastery of these tools leads to more informed entries and exits, optimizing trade performance in volatile markets.
Comparison Table
| Aspect | Volume Profile Reading | Candlestick Patterns |
|---|---|---|
| Definition | Analyzes traded volume at specific price levels over time to identify support and resistance. | Visual chart patterns formed by a sequence of candlesticks indicating potential market direction. |
| Data Focus | Volume distribution across price levels. | Price action represented by open, high, low, close (OHLC) data. |
| Primary Use | Identifying high-volume nodes, value areas, and market structure zones. | Spotting reversal and continuation signals like engulfing, doji, hammer. |
| Timeframe | Effective across multiple timeframes--intraday to weekly. | Applicable on all timeframes, often used for short-term signals. |
| Complexity | Requires volume data and interpretation of volume clusters. | Relatively simpler, based on standard candlestick shapes and patterns. |
| Market Insight | Shows trader interest and price acceptance zones. | Highlights immediate market sentiment and potential reversals. |
| Limitations | Volume data may be less reliable in some markets (e.g., forex). | Can produce false signals due to noise and ambiguous patterns. |
Which is better?
Volume profile reading provides a comprehensive view of market levels where significant trading activity occurs, highlighting support and resistance zones based on volume distribution. Candlestick patterns offer insights into potential price reversals and market sentiment through individual or grouped price bars, useful in short-term trading decisions. Combining volume profile analysis with candlestick patterns often yields more reliable trading signals by integrating market structure with price action dynamics.
Connection
Volume profile reading reveals the distribution of traded volume at specific price levels, highlighting key support and resistance zones. Candlestick patterns provide visual cues about market sentiment and potential price reversals at these critical volume areas. Combining volume profile data with candlestick analysis enhances accuracy in identifying high-probability trading setups.
Key Terms
**Candlestick Patterns:**
Candlestick patterns provide visual insights into market sentiment by illustrating price movements within specific timeframes, revealing potential reversals or continuations through formations like doji, hammer, and engulfing patterns. These patterns help traders identify entry and exit points by interpreting open, close, high, and low prices, making them essential for short-term trading strategies. Explore more to deepen your understanding of candlestick patterns and enhance your trading accuracy.
Doji
Doji candlestick patterns indicate market indecision, characterized by a nearly equal open and close price, signaling potential trend reversals or continuations. Volume profile reading complements Doji analysis by revealing the distribution of traded volume at specific price levels, providing insights into market strength and support/resistance zones. Explore how combining Doji patterns with volume profile data enhances precision in trading decisions.
Engulfing
Engulfing candlestick patterns signal potential trend reversals by showing a complete override of the previous candle's body, indicating strong buying or selling pressure. Volume profile reading complements this by highlighting trading activity at specific price levels, confirming the strength or weakness of the engulfing signal through volume clusters. Explore how combining engulfing patterns with volume profile analysis can enhance your market entry and exit strategies.
Source and External Links
40 Powerful Candlestick Patterns: Trading Guide for Beginners - Strike - This guide explains various candlestick patterns, including bullish reversal formations like the Morning Star and Morning Star Doji, which have success rates of around 65-68% in predicting trend reversals.
16 Candlestick Patterns Every Trader Should Know | IG International - This resource outlines 16 common candlestick patterns, such as the Dark Cloud Cover (bearish reversal) and neutral ones like Doji and Spinning Top, useful for identifying market indecision or continuation.
THE CANDLESTICK TRADING BIBLE - This document details the psychology and formation of key candlestick reversal patterns like the Hammer, emphasizing their significance in signaling potential trend changes after downtrends.