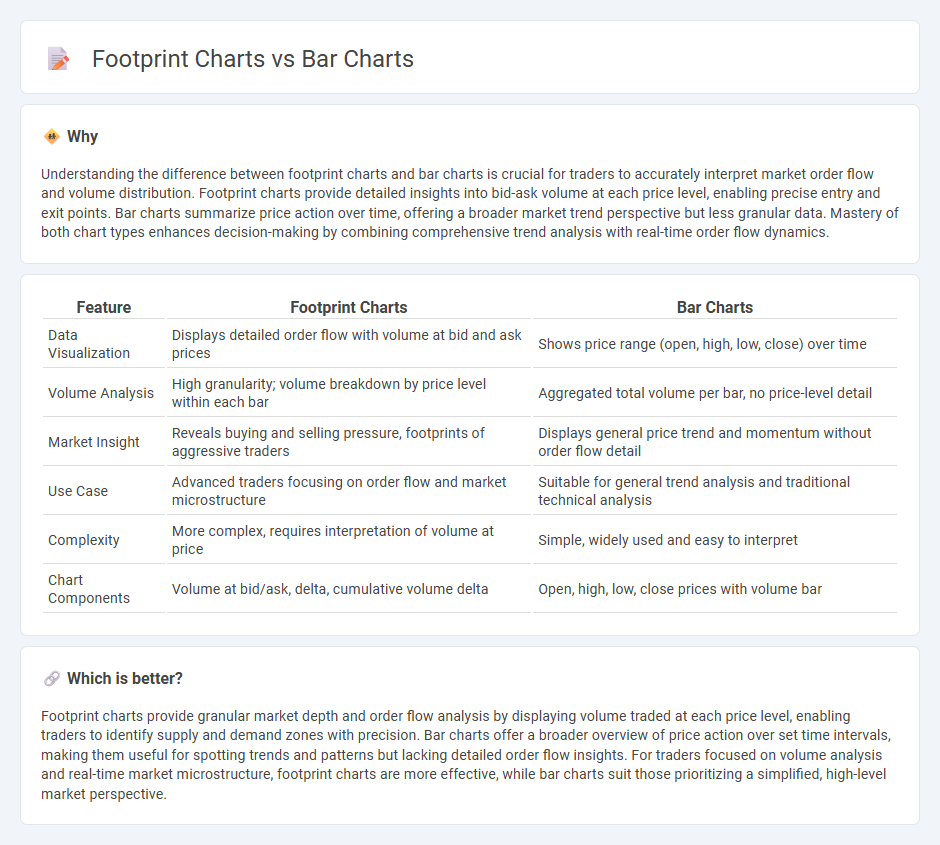
Footprint charts provide detailed insights by displaying volume and order flow information at each price level, offering a granular view of market activity beyond traditional bar charts. Bar charts summarize price movements within fixed time intervals, showing open, high, low, and close prices without volume depth, making them less effective for analyzing trading volume and liquidity. Explore the advantages of footprint charts to enhance your trading decisions and gain a deeper understanding of market dynamics.
Why it is important
Understanding the difference between footprint charts and bar charts is crucial for traders to accurately interpret market order flow and volume distribution. Footprint charts provide detailed insights into bid-ask volume at each price level, enabling precise entry and exit points. Bar charts summarize price action over time, offering a broader market trend perspective but less granular data. Mastery of both chart types enhances decision-making by combining comprehensive trend analysis with real-time order flow dynamics.
Comparison Table
| Feature | Footprint Charts | Bar Charts |
|---|---|---|
| Data Visualization | Displays detailed order flow with volume at bid and ask prices | Shows price range (open, high, low, close) over time |
| Volume Analysis | High granularity; volume breakdown by price level within each bar | Aggregated total volume per bar, no price-level detail |
| Market Insight | Reveals buying and selling pressure, footprints of aggressive traders | Displays general price trend and momentum without order flow detail |
| Use Case | Advanced traders focusing on order flow and market microstructure | Suitable for general trend analysis and traditional technical analysis |
| Complexity | More complex, requires interpretation of volume at price | Simple, widely used and easy to interpret |
| Chart Components | Volume at bid/ask, delta, cumulative volume delta | Open, high, low, close prices with volume bar |
Which is better?
Footprint charts provide granular market depth and order flow analysis by displaying volume traded at each price level, enabling traders to identify supply and demand zones with precision. Bar charts offer a broader overview of price action over set time intervals, making them useful for spotting trends and patterns but lacking detailed order flow insights. For traders focused on volume analysis and real-time market microstructure, footprint charts are more effective, while bar charts suit those prioritizing a simplified, high-level market perspective.
Connection
Footprint charts and bar charts both visualize price movements, but footprint charts provide granular information on order flow by displaying volume traded at each price level within a bar. Bar charts aggregate open, high, low, and close prices over fixed time intervals, while footprint charts enhance this by revealing buyer and seller intensity at precise price points. Integrating footprint charts with bar charts offers traders deeper insights into market sentiment and liquidity, improving trade decision accuracy.
Key Terms
Price Action
Bar charts display price action through open, high, low, and close prices for each time period, providing a clear overview of market trends and volatility. Footprint charts offer a deeper analysis by showing volume at each price level, revealing buying and selling pressure within the bars for enhanced market insight. Explore the nuances of these chart types to elevate your trading strategy.
Volume
Bar charts provide a clear representation of price movements over time but lack detailed volume distribution insights. Footprint charts enhance market analysis by displaying volume at each price level within a trading period, helping traders identify buying and selling pressure. Explore how footprint charts can improve your trading strategy by understanding volume dynamics more precisely.
Order Flow
Bar charts display price action through open, high, low, and close data over fixed time intervals, providing a simplified overview of market trends. Footprint charts reveal detailed order flow by showing volume executed at each price level, highlighting buying and selling pressure with granular precision. Explore the advantages of footprint charts to better understand market dynamics and improve trading strategies.
Source and External Links
Understanding and Using Bar Charts | Tableau - Bar charts are used to compare numerical values with the length of each bar representing the value, supporting comparisons across subcategories and showing data over discrete time intervals with variations like stacked or clustered bars.
A Complete Guide to Bar Charts - Atlassian - Bar charts visualize categorical data with bars where the length corresponds to numeric values, used to compare groups, showing distribution and ranking across distinct categories or aggregated temporal data.
Bar chart - Wikipedia - A bar chart displays categorical data with rectangular bars proportional in length or height to the values they represent, plotted vertically or horizontally, and is one of the earliest chart types dating back to the 18th century.
 dowidth.com