Data visualization dashboards transform complex accounting data into interactive charts and graphs, enabling real-time financial insights and trend analysis. Trial balance sheets provide a static summary of all ledger balances, essential for verifying the accuracy of bookkeeping before preparing financial statements. Explore how integrating both tools can enhance accuracy and decision-making in accounting processes.
Why it is important
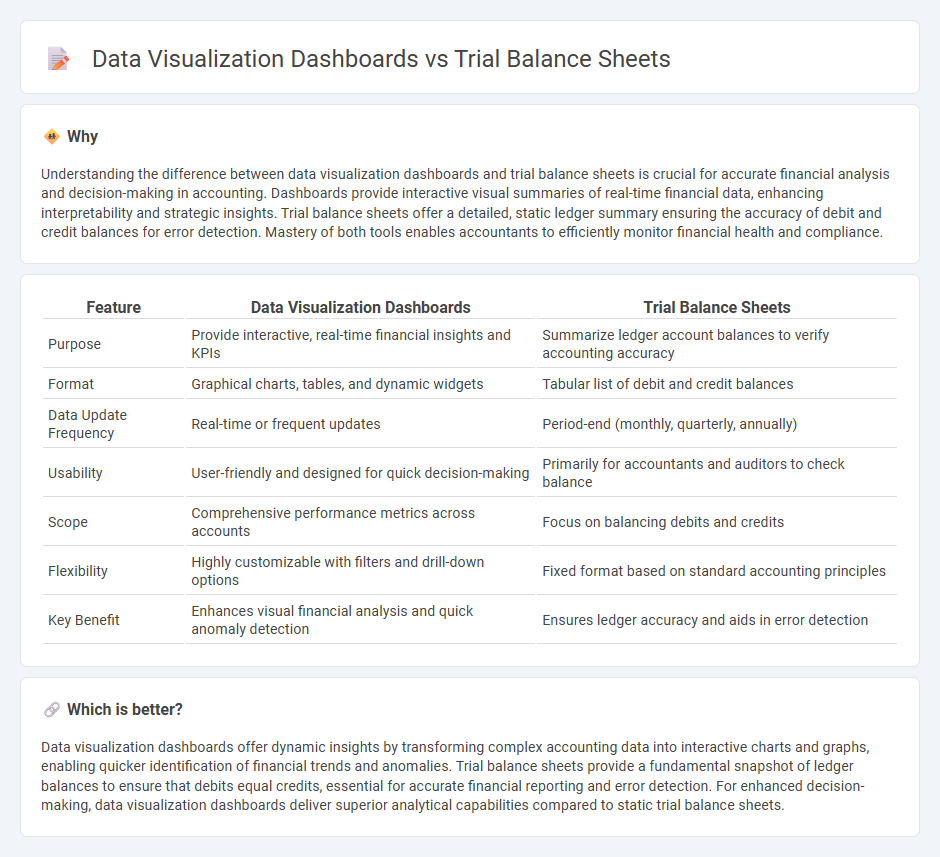
Understanding the difference between data visualization dashboards and trial balance sheets is crucial for accurate financial analysis and decision-making in accounting. Dashboards provide interactive visual summaries of real-time financial data, enhancing interpretability and strategic insights. Trial balance sheets offer a detailed, static ledger summary ensuring the accuracy of debit and credit balances for error detection. Mastery of both tools enables accountants to efficiently monitor financial health and compliance.
Comparison Table
| Feature | Data Visualization Dashboards | Trial Balance Sheets |
|---|---|---|
| Purpose | Provide interactive, real-time financial insights and KPIs | Summarize ledger account balances to verify accounting accuracy |
| Format | Graphical charts, tables, and dynamic widgets | Tabular list of debit and credit balances |
| Data Update Frequency | Real-time or frequent updates | Period-end (monthly, quarterly, annually) |
| Usability | User-friendly and designed for quick decision-making | Primarily for accountants and auditors to check balance |
| Scope | Comprehensive performance metrics across accounts | Focus on balancing debits and credits |
| Flexibility | Highly customizable with filters and drill-down options | Fixed format based on standard accounting principles |
| Key Benefit | Enhances visual financial analysis and quick anomaly detection | Ensures ledger accuracy and aids in error detection |
Which is better?
Data visualization dashboards offer dynamic insights by transforming complex accounting data into interactive charts and graphs, enabling quicker identification of financial trends and anomalies. Trial balance sheets provide a fundamental snapshot of ledger balances to ensure that debits equal credits, essential for accurate financial reporting and error detection. For enhanced decision-making, data visualization dashboards deliver superior analytical capabilities compared to static trial balance sheets.
Connection
Data visualization dashboards transform trial balance sheets into interactive graphics, enabling real-time insights into account balances, debits, and credits. By integrating trial balance data, dashboards highlight discrepancies and trends, enhancing accuracy in financial reporting. This synergy improves decision-making and streamlines audit processes through clear visual representation of accounting information.
Key Terms
Ledger Balances
Trial balance sheets provide a detailed summary of ledger balances, listing all debit and credit accounts to ensure that total debits equal total credits, which is fundamental for accurate financial reporting. Data visualization dashboards present ledger balances through interactive charts and graphs, enabling quick analysis and insights into financial trends and discrepancies. Explore how integrating trial balance accuracy with dynamic dashboard visuals can enhance financial decision-making and reporting efficiency.
Comparative Analysis
Trial balance sheets provide a precise snapshot of a company's financial position by summarizing all ledger accounts, essential for accurate accounting and error detection. Data visualization dashboards transform complex financial data into interactive, real-time graphical representations, enhancing clarity and aiding faster decision-making. Explore in-depth insights to understand how these tools complement each other in financial management.
Interactive Reporting
Trial balance sheets present static financial data summarizing account balances at a specific point in time, essential for accuracy in accounting records. Data visualization dashboards enhance interactive reporting by enabling dynamic exploration, real-time updates, and customizable views of financial performance metrics. Discover how integrating interactive dashboards with trial balance sheets can transform your financial analysis and decision-making process.
Source and External Links
What is a Trial Balance? Purpose, Rules and Examples - A trial balance is a report used during the accounting close process to verify that total debits equal total credits across all general ledger accounts at a certain point in time, showing account numbers, names, and debit and credit balances, including adjustments if any.
Trial Balance - Overview, What's Included, and Examples - It is a list of all general ledger account balances such as assets, liabilities, equity, revenues, and expenses used internally to check the accuracy of bookkeeping and is not an official financial statement.
What Is a Trial Balance? Definition and Types | Sage Advice US - The trial balance is a working report listing all ledger accounts and their debit or credit balances to ensure books are balanced, with primary types including unadjusted, adjusted, and post-closing trial balances.