Data visualization dashboards offer dynamic, real-time insights by transforming complex accounting data into interactive charts and graphs, enabling faster decision-making compared to static spreadsheets. Spreadsheets, while versatile for detailed calculations and data manipulation, often lack the immediacy and clarity of visual analytics necessary for quick financial assessments. Explore the advantages of data visualization dashboards over spreadsheets to enhance your accounting efficiency and accuracy.
Why it is important
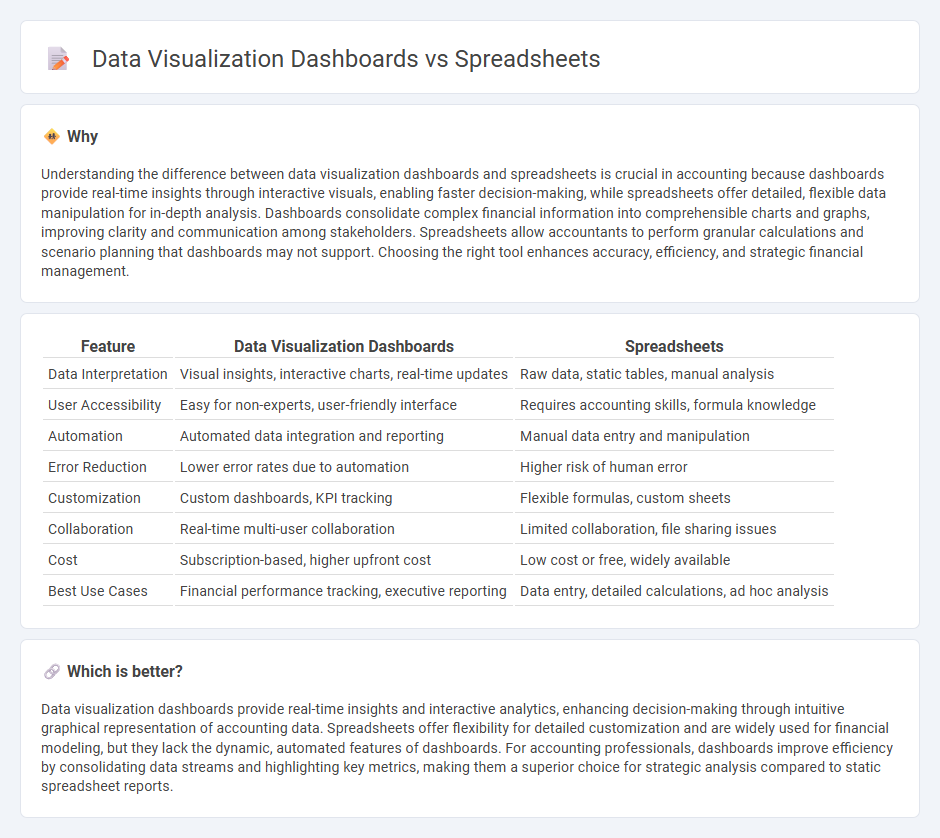
Understanding the difference between data visualization dashboards and spreadsheets is crucial in accounting because dashboards provide real-time insights through interactive visuals, enabling faster decision-making, while spreadsheets offer detailed, flexible data manipulation for in-depth analysis. Dashboards consolidate complex financial information into comprehensible charts and graphs, improving clarity and communication among stakeholders. Spreadsheets allow accountants to perform granular calculations and scenario planning that dashboards may not support. Choosing the right tool enhances accuracy, efficiency, and strategic financial management.
Comparison Table
| Feature | Data Visualization Dashboards | Spreadsheets |
|---|---|---|
| Data Interpretation | Visual insights, interactive charts, real-time updates | Raw data, static tables, manual analysis |
| User Accessibility | Easy for non-experts, user-friendly interface | Requires accounting skills, formula knowledge |
| Automation | Automated data integration and reporting | Manual data entry and manipulation |
| Error Reduction | Lower error rates due to automation | Higher risk of human error |
| Customization | Custom dashboards, KPI tracking | Flexible formulas, custom sheets |
| Collaboration | Real-time multi-user collaboration | Limited collaboration, file sharing issues |
| Cost | Subscription-based, higher upfront cost | Low cost or free, widely available |
| Best Use Cases | Financial performance tracking, executive reporting | Data entry, detailed calculations, ad hoc analysis |
Which is better?
Data visualization dashboards provide real-time insights and interactive analytics, enhancing decision-making through intuitive graphical representation of accounting data. Spreadsheets offer flexibility for detailed customization and are widely used for financial modeling, but they lack the dynamic, automated features of dashboards. For accounting professionals, dashboards improve efficiency by consolidating data streams and highlighting key metrics, making them a superior choice for strategic analysis compared to static spreadsheet reports.
Connection
Data visualization dashboards integrate seamlessly with spreadsheets by transforming raw numerical data into interactive graphical representations, enabling clearer insights and faster decision-making. Spreadsheets serve as the foundational data source, where accounting figures are organized, calculated, and updated in real-time, while dashboards use this structured data to generate dynamic charts and key performance indicators (KPIs). This connection enhances accuracy in financial reporting, improves trend analysis, and streamlines workflow efficiency for accounting professionals.
Key Terms
Data Entry
Spreadsheets excel in flexible, detailed data entry with customizable cells for formulas, text, and numerical input, making them ideal for granular data management. Data visualization dashboards prioritize real-time insights by aggregating and displaying pre-processed data, often limiting direct data entry capabilities to ensure data integrity. Explore how each tool balances data entry and analysis to optimize your workflow.
Real-Time Analytics
Data visualization dashboards provide superior real-time analytics by integrating dynamic data sources and enabling instant updates, which spreadsheets often struggle to match due to manual refresh requirements. Dashboards utilize interactive charts and filters to offer immediate insights, facilitating faster decision-making in environments where time-sensitive data is critical. Explore how leveraging advanced visualization tools can transform your real-time analytics strategy for improved business outcomes.
Performance Metrics
Spreadsheets excel at detailed data entry and numerical analysis, enabling precise manipulation of performance metrics but often lack real-time interactivity. Data visualization dashboards transform complex datasets into intuitive visual formats, offering dynamic insights and instant identification of trends to drive decision-making efficiency. Explore how integrating these tools can optimize your performance metrics analysis and enhance strategic outcomes.
Source and External Links
Spreadsheet - Wikipedia - A spreadsheet is a computer application designed for data computation, organization, analysis, and storage in tabular form, allowing users to enter data in cells, perform automatic calculations with formulas, and conduct what-if analyses with multiple sheets and graphical displays.
Google Sheets on the App Store - Google Sheets is a mobile app that enables creating, editing, and collaborating on spreadsheets anywhere with real-time collaboration features, offline access, automatic saving, and compatibility with Excel files, enhanced by AI-powered insights for Google Workspace subscribers.
Google Sheets: Online Spreadsheets & Templates - Google Sheets offers online, AI-powered spreadsheets for data management, visualization, and analysis, featuring tools like Gemini, which helps build, format, and analyze spreadsheets quickly using AI-driven suggestions and collaborative functionalities for teams.