Data visualization dashboards transform raw accounting data into interactive graphs and charts, enabling real-time insights into financial trends and performance metrics. Printed reports offer a static, tangible record of accounting information, often utilized for formal audits and historical documentation. Discover how leveraging dynamic dashboards can enhance decision-making and efficiency in your accounting processes.
Why it is important
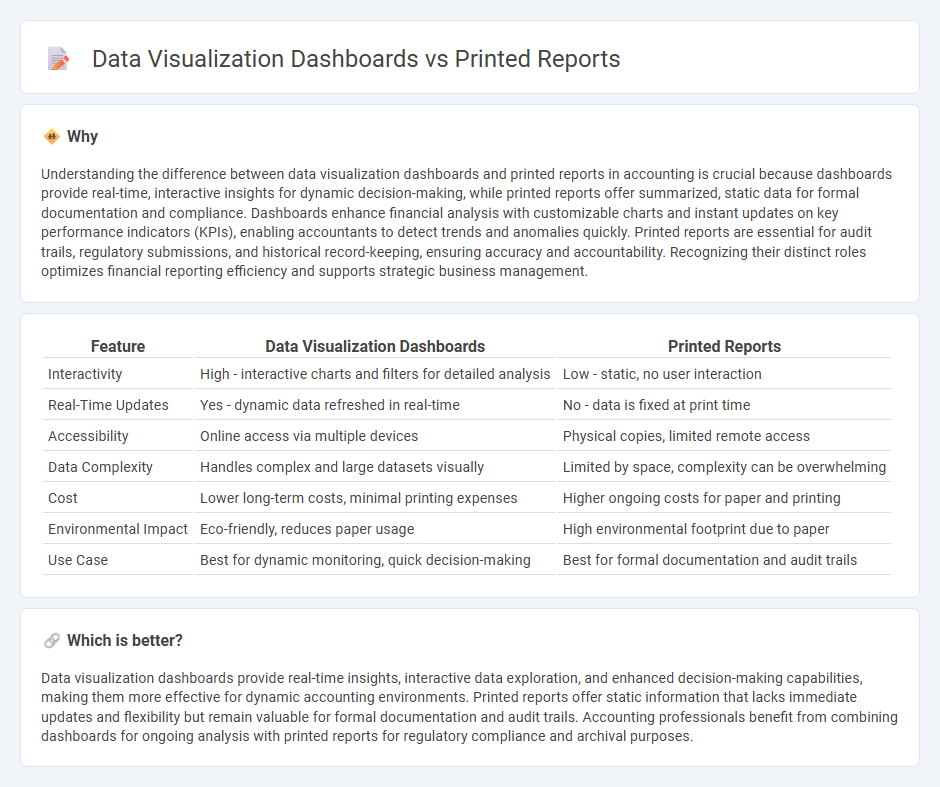
Understanding the difference between data visualization dashboards and printed reports in accounting is crucial because dashboards provide real-time, interactive insights for dynamic decision-making, while printed reports offer summarized, static data for formal documentation and compliance. Dashboards enhance financial analysis with customizable charts and instant updates on key performance indicators (KPIs), enabling accountants to detect trends and anomalies quickly. Printed reports are essential for audit trails, regulatory submissions, and historical record-keeping, ensuring accuracy and accountability. Recognizing their distinct roles optimizes financial reporting efficiency and supports strategic business management.
Comparison Table
| Feature | Data Visualization Dashboards | Printed Reports |
|---|---|---|
| Interactivity | High - interactive charts and filters for detailed analysis | Low - static, no user interaction |
| Real-Time Updates | Yes - dynamic data refreshed in real-time | No - data is fixed at print time |
| Accessibility | Online access via multiple devices | Physical copies, limited remote access |
| Data Complexity | Handles complex and large datasets visually | Limited by space, complexity can be overwhelming |
| Cost | Lower long-term costs, minimal printing expenses | Higher ongoing costs for paper and printing |
| Environmental Impact | Eco-friendly, reduces paper usage | High environmental footprint due to paper |
| Use Case | Best for dynamic monitoring, quick decision-making | Best for formal documentation and audit trails |
Which is better?
Data visualization dashboards provide real-time insights, interactive data exploration, and enhanced decision-making capabilities, making them more effective for dynamic accounting environments. Printed reports offer static information that lacks immediate updates and flexibility but remain valuable for formal documentation and audit trails. Accounting professionals benefit from combining dashboards for ongoing analysis with printed reports for regulatory compliance and archival purposes.
Connection
Data visualization dashboards and printed reports in accounting both serve to present financial data clearly and effectively, enhancing decision-making and compliance. Dashboards offer real-time, interactive insights through charts and graphs, while printed reports provide formal, static documentation often required for audits and regulatory purposes. Integrating these tools ensures comprehensive financial analysis, combining dynamic overview with detailed records.
Key Terms
Financial Statements
Financial statements presented in printed reports offer a traditional, tangible format ideal for detailed review, compliance, and record-keeping but may lack real-time updates. Data visualization dashboards transform these financial metrics into dynamic and interactive charts, enabling quick insights, trend analysis, and effective decision-making. Explore the advantages of integrating data visualization dashboards with financial statements for enhanced fiscal transparency and control.
Key Performance Indicators (KPIs)
Printed reports provide static, detailed documentation of Key Performance Indicators (KPIs) that are useful for historical reference and compliance audits. Data visualization dashboards offer dynamic, real-time tracking of KPIs with interactive charts and graphs, enabling faster decision-making and trend analysis. Explore how integrating both methods can optimize your KPI monitoring and business performance.
Real-time Analysis
Printed reports offer static snapshots of data, limiting the ability to assess changes as they occur, while data visualization dashboards provide dynamic, real-time insights through interactive charts and graphs. Real-time analysis enables quicker decision-making by continuously updating key metrics and highlighting trends or anomalies as they emerge. Explore the advantages of data visualization dashboards for enhanced, up-to-the-minute data interpretation.
Source and External Links
Print Reporting: A Guide on Why It Matters and How to Do It - This guide provides insights into the importance of print reporting for managing printing costs and optimizing resource usage.
How to Print a Report - MicroStrategy - This resource explains how to print reports through a browser or PDF, highlighting PDF's flexibility in adjusting print settings.
Print a Report (Power BI Report Builder) - This guide details how to print and manage reports in Power BI, including setting paper sizes and margins during printing.