Data visualization dashboards enhance accounting by providing real-time, interactive insights into financial performance, enabling faster decision-making and trend analysis. Cost accounting worksheets offer detailed, structured breakdowns of expenses to accurately allocate costs and support budgeting processes. Explore how integrating these tools can elevate your accounting accuracy and efficiency.
Why it is important
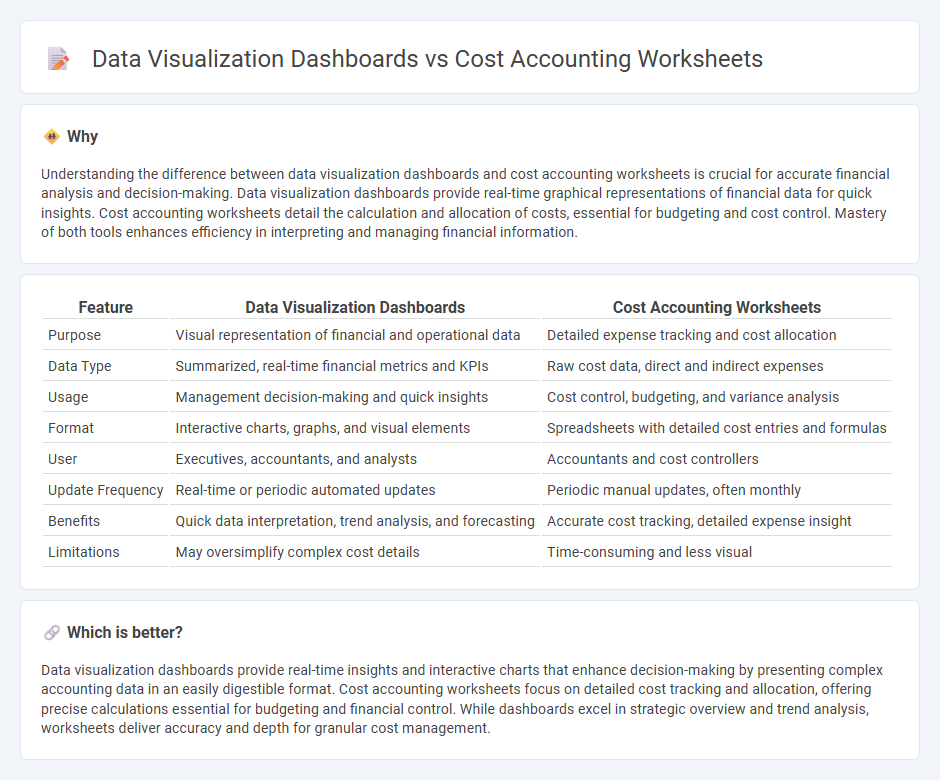
Understanding the difference between data visualization dashboards and cost accounting worksheets is crucial for accurate financial analysis and decision-making. Data visualization dashboards provide real-time graphical representations of financial data for quick insights. Cost accounting worksheets detail the calculation and allocation of costs, essential for budgeting and cost control. Mastery of both tools enhances efficiency in interpreting and managing financial information.
Comparison Table
| Feature | Data Visualization Dashboards | Cost Accounting Worksheets |
|---|---|---|
| Purpose | Visual representation of financial and operational data | Detailed expense tracking and cost allocation |
| Data Type | Summarized, real-time financial metrics and KPIs | Raw cost data, direct and indirect expenses |
| Usage | Management decision-making and quick insights | Cost control, budgeting, and variance analysis |
| Format | Interactive charts, graphs, and visual elements | Spreadsheets with detailed cost entries and formulas |
| User | Executives, accountants, and analysts | Accountants and cost controllers |
| Update Frequency | Real-time or periodic automated updates | Periodic manual updates, often monthly |
| Benefits | Quick data interpretation, trend analysis, and forecasting | Accurate cost tracking, detailed expense insight |
| Limitations | May oversimplify complex cost details | Time-consuming and less visual |
Which is better?
Data visualization dashboards provide real-time insights and interactive charts that enhance decision-making by presenting complex accounting data in an easily digestible format. Cost accounting worksheets focus on detailed cost tracking and allocation, offering precise calculations essential for budgeting and financial control. While dashboards excel in strategic overview and trend analysis, worksheets deliver accuracy and depth for granular cost management.
Connection
Data visualization dashboards enhance cost accounting by providing real-time insights into expense categories, budget variances, and profitability metrics through interactive charts and graphs. Cost accounting worksheets supply the detailed financial data necessary for these dashboards to accurately track and analyze cost behaviors, enabling more informed decision-making. Integrating these tools improves accuracy in cost control and financial performance monitoring.
Key Terms
Overhead Allocation
Cost accounting worksheets detail overhead allocation by systematically recording expenses and assigning indirect costs to specific cost centers or products based on predetermined rates or activity drivers. Data visualization dashboards transform this data into interactive charts and graphs, offering real-time insights that enhance decision-making and highlight overhead cost trends or anomalies. Explore how integrating both tools can optimize overhead allocation accuracy and business performance.
Variance Analysis
Cost accounting worksheets provide detailed numeric data necessary for precise variance analysis, highlighting discrepancies between actual and standard costs. Data visualization dashboards enhance interpretability by presenting variance trends and deviations through graphs and charts, facilitating quicker decision-making. Explore deeper insights into how combining both tools can optimize your variance analysis process.
Real-Time Reporting
Cost accounting worksheets primarily facilitate detailed expense tracking and budget variance analysis, enabling precise cost management for manufacturing and service industries. Data visualization dashboards offer dynamic, real-time reporting by integrating multiple data sources, highlighting key performance indicators (KPIs) with interactive charts and graphs that enhance decision-making efficiency. Explore how leveraging real-time dashboards can transform traditional cost accounting processes and drive timely business insights.
Source and External Links
Cost Sheet Illustrations and Solutions - SIES College - Provides a detailed example of preparing a cost accounting worksheet including prime cost, works cost, cost of production, and cost of sales with real figures.
Cost Accounting For Dummies Cheat Sheet - Explains various cost accounting methods and terms, useful for understanding the types of costs and worksheets involved in cost accounting.
Managerial and Cost Accounting Exercises II - WBI Library System - Contains worksheets and exercises exploring variable costs, fixed costs, and cost behavior helpful for cost accounting analysis and worksheet preparation.