Order flow footprint provides detailed real-time insight into market transactions by displaying individual buy and sell orders, highlighting precise liquidity levels and trader behavior. Volume Profile aggregates traded volume at price levels over a specific period, identifying key support and resistance zones based on historical activity. Explore the nuances of these powerful trading tools to refine your market strategy.
Why it is important
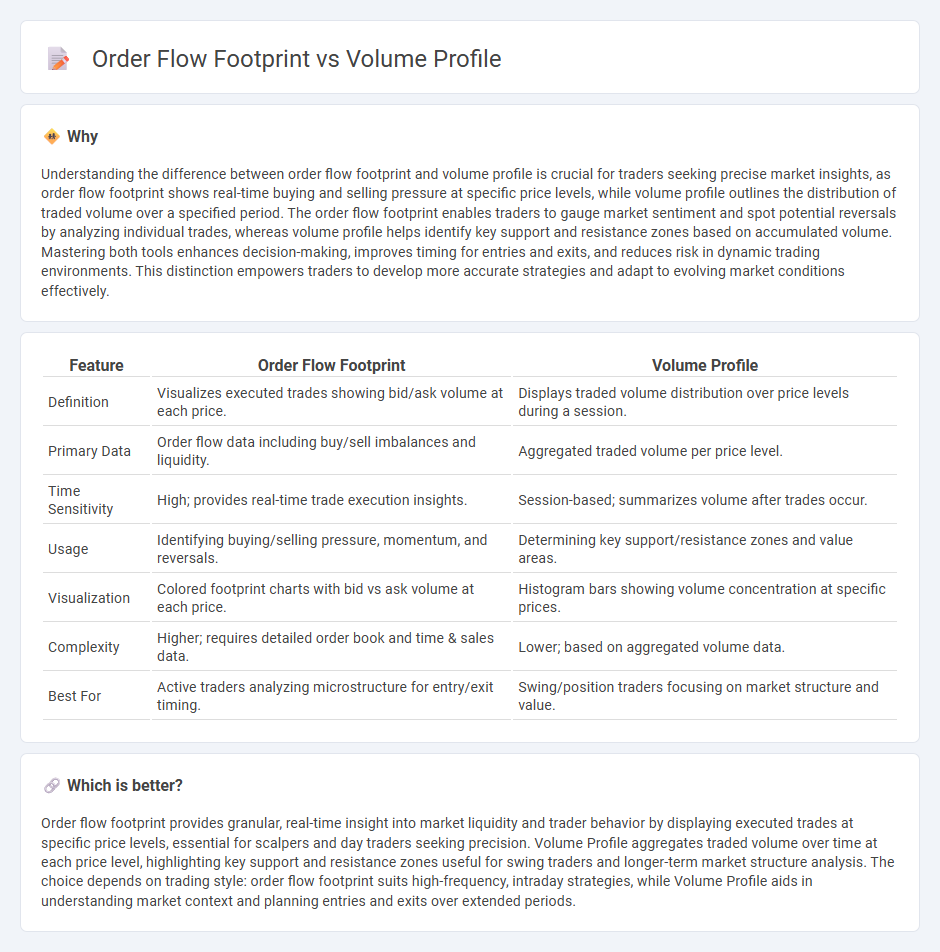
Understanding the difference between order flow footprint and volume profile is crucial for traders seeking precise market insights, as order flow footprint shows real-time buying and selling pressure at specific price levels, while volume profile outlines the distribution of traded volume over a specified period. The order flow footprint enables traders to gauge market sentiment and spot potential reversals by analyzing individual trades, whereas volume profile helps identify key support and resistance zones based on accumulated volume. Mastering both tools enhances decision-making, improves timing for entries and exits, and reduces risk in dynamic trading environments. This distinction empowers traders to develop more accurate strategies and adapt to evolving market conditions effectively.
Comparison Table
| Feature | Order Flow Footprint | Volume Profile |
|---|---|---|
| Definition | Visualizes executed trades showing bid/ask volume at each price. | Displays traded volume distribution over price levels during a session. |
| Primary Data | Order flow data including buy/sell imbalances and liquidity. | Aggregated traded volume per price level. |
| Time Sensitivity | High; provides real-time trade execution insights. | Session-based; summarizes volume after trades occur. |
| Usage | Identifying buying/selling pressure, momentum, and reversals. | Determining key support/resistance zones and value areas. |
| Visualization | Colored footprint charts with bid vs ask volume at each price. | Histogram bars showing volume concentration at specific prices. |
| Complexity | Higher; requires detailed order book and time & sales data. | Lower; based on aggregated volume data. |
| Best For | Active traders analyzing microstructure for entry/exit timing. | Swing/position traders focusing on market structure and value. |
Which is better?
Order flow footprint provides granular, real-time insight into market liquidity and trader behavior by displaying executed trades at specific price levels, essential for scalpers and day traders seeking precision. Volume Profile aggregates traded volume over time at each price level, highlighting key support and resistance zones useful for swing traders and longer-term market structure analysis. The choice depends on trading style: order flow footprint suits high-frequency, intraday strategies, while Volume Profile aids in understanding market context and planning entries and exits over extended periods.
Connection
Order flow footprint charts reveal detailed transaction data by displaying the precise volume of buying and selling at each price level, while Volume Profile aggregates this volume information over a specified period to highlight significant price levels. Both tools analyze market activity to identify key areas of support and resistance by visualizing where high trading activity occurs. Integrating order flow footprint with Volume Profile enhances traders' ability to detect market sentiment shifts and optimize entry and exit points based on volume distribution patterns.
Key Terms
Volume Nodes
Volume Profile highlights key price levels by aggregating traded volume into Volume Nodes, revealing areas of high liquidity and market interest. Order Flow Footprint displays real-time transaction data, emphasizing bid-ask dynamics and the microstructure of price movement around these nodes. Explore how integrating Volume Nodes into order flow analysis enhances precision in identifying support and resistance levels.
Bid-Ask Imbalance
Volume Profile visually represents traded volume at price levels, highlighting areas of high liquidity and potential support or resistance. Order Flow Footprint emphasizes real-time Bid-Ask Imbalance, revealing aggressor side dominance and market sentiment shifts within each price bar. Explore deeper insights into Bid-Ask Imbalance and how it sharpens trading decisions through precise order flow analysis.
Delta
Volume Profile highlights traded volume distribution at various price levels, revealing key support and resistance zones through cumulative data. Order Flow Footprint emphasizes real-time market activity by detailing Delta, the net difference between buying and selling pressure, offering precise insights into momentum shifts. Explore deeper analysis to leverage Delta for enhancing trading strategies.
Source and External Links
Advanced Day Trading Strategies Using Volume Profile - TradingSim - Volume Profile is a volume-by-price trading indicator showing total volume traded at each price level over a specified period, revealing significant price levels and improving trading performance by visualizing volume distribution on price charts as a histogram with up/down volume distinctions.
Understanding Volume Profile: A Powerful Tool for Traders - Volume Profile plots trading volume against price instead of time, enabling traders to identify key price levels with high liquidity that often act as strong support/resistance zones, thus enhancing understanding of crucial trading activity zones.
Volume profile indicators: basic concepts - TradingView - Volume Profile is an advanced indicator displaying trading activity over a time period at specified price levels by plotting a histogram calculated from lower timeframe data, distinguishing up and down volume to highlight dominant volume price levels and supporting various types like anchored or fixed range profiles.